Ulogd Graphite output plugin
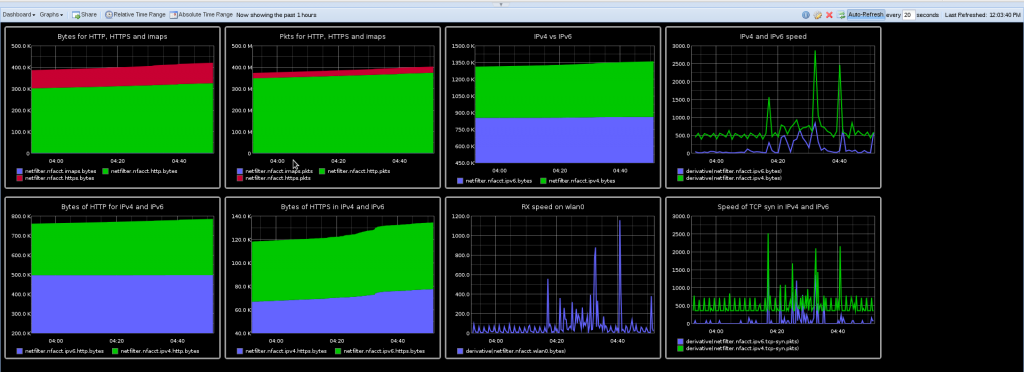
I’m committed a new output plugin for ulogd. The idea is to send NFACCT accounting data to a graphite server to be able to display the received data. Graphite is a web application which provide real-time visualization and storage of numeric time-series data.
Once data are sent to the graphite server, it is possible to use the web interface to setup different dashboard and graphs (including combination and mathematical operation):

Nfacct setup
One really interesting thing is that Graphite is using a tree hierarchy for data and this hierarchy is build by using a dot separator. So it really matches ulogd key system and on top of that nfacct can be used to create this hierarchy:
nfacct add ipv4.http
nfacct add ipv6.http
Once a counter is created in NFACCT it is instantly sent by ulogd to Graphite and can be used to create graph. To really use the counter, some iptables rules needs to be setup. To continue on previous example, we can use:
ip6tables -I INPUT -p tcp --sport 80 -m nfacct --nfacct-name ipv6.http
ip6tables -I OUTPUT -p tcp --dport 80 -m nfacct --nfacct-name ipv6.http
iptables -I INPUT -p tcp --sport 80 -m nfacct --nfacct-name ipv4.http
iptables -I OUTPUT -p tcp --dport 80 -m nfacct --nfacct-name ipv4.http
To save counters, you can use:
nfacct list >nfacct.dump
and you can restore them with:
nfacct restore <nfacct.dump
Ulogd setup
Ulogd setup is easy, simply add a new stack to ulogd.conf:
stack=acct1:NFACCT,graphite1:GRAPHITE
The configuration of NFACCT is simple, there is only one option which is the polling interval. The plugin will dump all nfacct counter at the given interval:
[acct1]
pollinterval = 2
The Graphite output module is easy to setup, you only need to specify the host and the port of the Graphite collector:
[graphite1]
host="127.0.0.1"
port="2003"