Using linux perf tools for Suricata performance analysis

Introduction

Perf is a great tool to analyse performances on Linux boxes. For example, perf top will give you this type of output on a box running Suricata on a high speed network:

Events: 32K cycles                                                                                                                                                                                                                            
 28.41%  suricata            [.] SCACSearch
 19.86%  libc-2.15.so        [.] tolower
 17.83%  suricata            [.] SigMatchSignaturesBuildMatchArray
  6.11%  suricata            [.] SigMatchSignaturesBuildMatchArrayAddSignature
  2.06%  suricata            [.] tolower@plt
  1.70%  libpthread-2.15.so  [.] pthread_mutex_trylock
  1.17%  suricata            [.] StreamTcpGetFlowState
  1.10%  libc-2.15.so        [.] __memcpy_ssse3_back
  0.90%  libpthread-2.15.so  [.] pthread_mutex_lock

The functions are sorted by CPU consumption. Using arrow key it is possible to jump into the annotated code to see where most CPU cycles are used.

This is really useful but in the case of a function like pthread_mutex_trylock, the interesting part is to be able to find where this function is called.

Getting function call graph in perf

This stack overflow question lead me to the solution.

I’ve started to build suricata with the -fno-omit-frame-pointer option:

./configure --enable-pfring --enable-luajit CFLAGS="-fno-omit-frame-pointer"
make
make install

Once suricata was restarted (with pid being 9366), I was then able to record the data:

sudo perf record -a --call-graph -p 9366

Extracting the call graph was then possible by running:

sudo perf report --call-graph --stdio

The result is a huge detailed report. For example, here’s the part on pthread_mutex_lock:

     0.94%  Suricata-Main  libpthread-2.15.so     [.] pthread_mutex_lock
            |
            --- pthread_mutex_lock
               |
               |--48.69%-- FlowHandlePacket
               |          |
               |          |--53.04%-- DecodeUDP
               |          |          |
               |          |          |--95.84%-- DecodeIPV4
               |          |          |          |
               |          |          |          |--99.97%-- DecodeVLAN
               |          |          |          |          DecodeEthernet
               |          |          |          |          DecodePfring
               |          |          |          |          TmThreadsSlotVarRun
               |          |          |          |          TmThreadsSlotProcessPkt
               |          |          |          |          ReceivePfringLoop
               |          |          |          |          TmThreadsSlotPktAcqLoop
               |          |          |          |          start_thread
               |          |          |           --0.03%-- [...]
               |          |          |
               |          |           --4.16%-- DecodeIPV6
               |          |                     |
               |          |                     |--97.59%-- DecodeTunnel
               |          |                     |          |
               |          |                     |          |--99.18%-- DecodeTeredo
               |          |                     |          |          DecodeUDP
               |          |                     |          |          DecodeIPV4
               |          |                     |          |          DecodeVLAN
               |          |                     |          |          DecodeEthernet
               |          |                     |          |          DecodePfring
               |          |                     |          |          TmThreadsSlotVarRun
               |          |                     |          |          TmThreadsSlotProcessPkt
               |          |                     |          |          ReceivePfringLoop
               |          |                     |          |          TmThreadsSlotPktAcqLoop
               |          |                     |          |          start_thread
               |          |                     |          |
               |          |                     |           --0.82%-- DecodeIPV4
               |          |                     |                     DecodeVLAN
               |          |                     |                     DecodeEthernet
               |          |                     |                     DecodePfring
               |          |                     |                     TmThreadsSlotVarRun
               |          |                     |                     TmThreadsSlotProcessPkt
               |          |                     |                     ReceivePfringLoop
               |          |                     |                     TmThreadsSlotPktAcqLoop
               |          |                     |                     start_thread
               |          |                     |
               |          |                      --2.41%-- DecodeIPV6
               |          |                                DecodeTunnel
               |          |                                DecodeTeredo
               |          |                                DecodeUDP
               |          |                                DecodeIPV4
               |          |                                DecodeVLAN
               |          |                                DecodeEthernet
               |          |                                DecodePfring
               |          |                                TmThreadsSlotVarRun
               |          |                                TmThreadsSlotProcessPkt
               |          |                                ReceivePfringLoop
               |          |                                TmThreadsSlotPktAcqLoop
               |          |                                start_thread
Suricata, to 10Gbps and beyond

Introduction

Since the beginning of July 2012, OISF team is able to access to a server where one interface is receiving
some mirrored real European traffic. When reading "some", think between 5Gbps and 9.5Gbps
constant traffic. With that traffic, this is around 1Mpps to 1.5M packet per seconds we have to study.

The box itself is a standard server with the following characteristics:

  • CPU: One Intel(R) Xeon(R) CPU E5-2680 0 @ 2.70GHz (16 cores counting Hyperthreading)
  • Memory: 32Go
  • capture NIC: Intel 82599EB 10-Gigabit SFI/SFP+

The objective is simple: be able to run Suricata on this box and treat the whole
traffic with a decent number of rules. With the constraint not to use any non
official system code (plain system and kernel if we omit a driver).

The code on the box have been updated October 4th:

  • It runs Suricata 1.4beta2
  • with 6719 signatures
  • and 0% packet loss
  • with setup described below

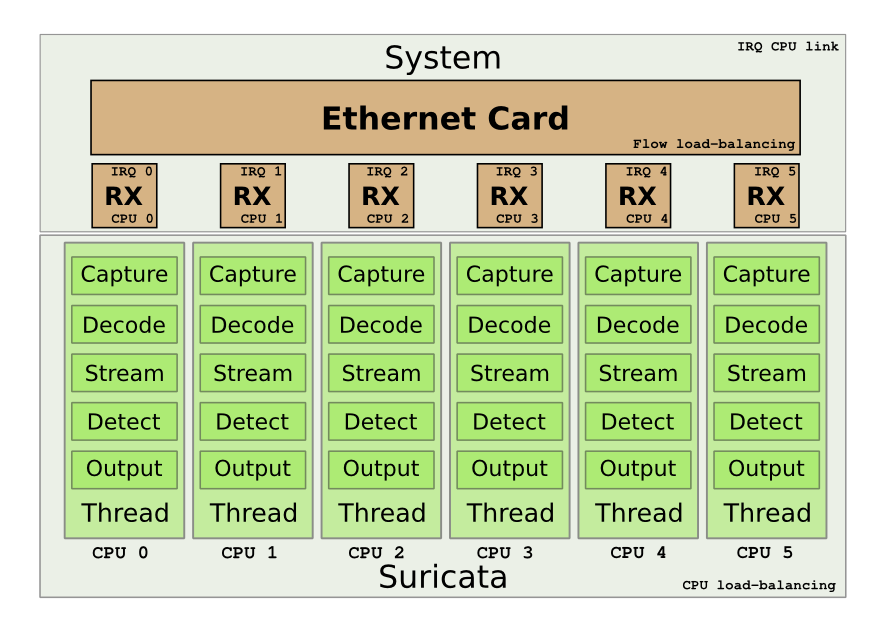
The setup is explained by the following schema:

We want to use the multiqueue system on the Intel card to be able to load balance the treatment. Next goal is to have one single CPU to treat the packet from the start to the end.

Peter Manev, Matt Jonkmann, Anoop Saldanha and Eric Leblond (myself) have been involved in
the here described setup.

Detailed method

The Intel NIC benefits from a multiqueue system. The RX/TX traffic can be load-balanced
on different interrupts. In our case, this permit to handle a part of the flow on each
CPU. One really interesting thing is that the load-balancing can be done with respect
to the IP flows. By default, one RX queue is created per-CPU.

More information about multiqueue ethernet devices can be found in the document
networking/scaling.txt in the Documentation directory of Linux sources.

Suricata is able to do zero-copy in AF_PACKET capture mode. One other interesting feature
of this mode is that you can have multiple threads listening to the same interface. In
our case, we can start one threads per queue to have a load-balancing of capture on all
our resources.

Suricata has different running modes which define how the different parts of the engine
(decoding, streaming, siganture, output) are chained. One of the mode is the ‘workers’
mode where all the treatment for a packet is made on a single thread. This mode is
adapted to our setup as it will permit to keep the work from start to end on a single
thread. By using the CPU affinity system available in Suricata, we can assign each
thread to a single CPU. By doing this the treatment of each packet can be done on
a single CPU.

But this does not solve one problem which is the link between the CPU receiving the packet
and the one used in Suricata.
To do so we have to ensure that when a packet is received on a queue, the CPU that will
handle the packet will be the same as the one treating the packet in Suricata. David
Miller had already planned this kind of setup when coding the fanout mode of AF_PACKET.
One of the flow load balancing mode is flow_cpu. In this mode, the packet is delivered to
the same track depending on the CPU.

The dispatch is made by using the formula "cpu % num" where cpu is the cpu number and
num is the number of socket bound to the same fanout socket. By the way, this imply
you can’t have a number of sockets superior to the number of CPUs.
A code study shows that the assignement in the array of sockets is incrementally made.
Thus first socket to bind will be assigned to the first CPU, etc..
In case, a socket disconnect from the set, the last socket of the array will take the empty place.
This implies the optimizations will be partially lost in case of a disconnect.

By using the flow_cpu dispatch of AF_PACKET and the workers mode of Suricata, we can
manage to keep all work on the same CPU.

Preparing the system

The operating system running on is an Ubuntu 12.04 and the driver igxbe
was outdated.
Using the instruction available on Intel website (README.txt),
we’ve updated the driver.
Next step was to unload the old driver and load the new one

sudo rmmod ixgbe
sudo modprobe ixgbe FdirPballoc=3

Doing this we’ve also tried to use the RSS variable. But it seems there is an issue, as we still having 16 queues although the RSS params was
set to 8.

Once done, the next thing is to setup the IRQ handling to have each CPU linked in order with
the corresponding RX queue. irqbalance was running on the system and the setup was
correctly made.

The interface was using IRQ 101 to 116 and /proc/interrupts show a diagonale indicating
that each CPU was assigned to one interrupt.

If not, it was possible to use the instruction contained in IRQ-affinity.txt available
in the Documentation directory of Linux sources.

But the easy way to do it is to use the script provided with the driver:

ixgbe-3.10.16/scripts$ ./set_irq_affinity.sh eth3

Note: Intel latest driver was responsible of a decrease of CPU usage. With Ubuntu kernel version, the CPU usage as 80% and it is 45% with latest Intel driver.

The card used on the system was not load-balancing UDP flow using port. We had to use
‘ethtool’ to fix this

regit@suricata:~$ sudo ethtool -n eth3 rx-flow-hash udp4
UDP over IPV4 flows use these fields for computing Hash flow key:
IP SA
IP DA

regit@suricata:~$ sudo ethtool -N eth3 rx-flow-hash udp4 sdfn
regit@suricata:~$ sudo ethtool -n eth3 rx-flow-hash udp4
UDP over IPV4 flows use these fields for computing Hash flow key:
IP SA
IP DA
L4 bytes 0 & 1 [TCP/UDP src port]
L4 bytes 2 & 3 [TCP/UDP dst port]

In our case, the default setting of the ring parameters of the card, seems
to indicate it is possible to increase the ring buffer on the card

regit@suricata:~$ ethtool -g eth3
Ring parameters for eth3:
Pre-set maximums:
RX:             4096
RX Mini:        0
RX Jumbo:       0
TX:             4096
Current hardware settings:
RX:             512
RX Mini:        0
RX Jumbo:       0
TX:             512

Our system is now ready and we can start configuring Suricata.

Suricata setup

Global variables

The run mode has been set to ‘workers’

max-pending-packets: 512
runmode: workers

As pointed out by Victor Julien, this is not necessary to increase max-pending-packets too much because only a number of packets equal to the total number of worker threads can be treated simultaneously.

Suricata 1.4beta1 introduce a delayed-detect variable under detect-engine. If set to yes, this trigger a build of signature after the packet capture threads have started working. This is a potential issue if your system is short in CPU as the task of building the detect engine is CPU intensive and can cause some packet loss. That’s why it is recommended to let it to the default value of no.

AF_PACKET

The AF_PACKET configuration is almost straight forward

af-packet:
  - interface: eth3
    threads: 16
    cluster-id: 99
    cluster-type: cluster_cpu
    defrag: yes
    use-mmap: yes
    ring-size: 300000
Affinity

Affinity settings permit to assign thread to set of CPUs. In our case, we onlSet to have in exclusive mode one packet thread dedicated to each CPU. The setting
used to define packet thread property in ‘workers’ mode is ‘detect-cpu-set’

threading:
  set-cpu-affinity: yes
  cpu-affinity:
    - management-cpu-set:
      cpu: [ "all" ]
      mode: "balanced"
      prio:
        default: "low"

  - detect-cpu-set:
      cpu: ["all"]
      mode: "exclusive" # run detect threads in these cpus
      prio:
        default: "high"

The idea is to assign the highest prio to detect threads and to let the OS do its best
to dispatch the remaining work among the CPUs (balanced mode on all CPUs for the management).

Defrag

Some tuning was needed here. The network was exhibing some serious fragmentation
and we have to modify the default settings

defrag:
  memcap: 512mb
  trackers: 65535 # number of defragmented flows to follow
  max-frags: 65535  # number of fragments

The ‘trackers’ variable was not documented in the original YAML configuration file.
Although defined in the YAML, the ‘max-frags’ one was not used by Suricata. A patch
has been made to implement this.

Streaming

The variables relative to streaming have been set very high

stream:
  memcap: 12gb
  max-sessions: 20000000
  prealloc-sessions: 10000000
  inline: no                    # no inline mode
  reassembly:
    memcap: 14gb
    depth: 6mb                  # reassemble 1mb into a stream
    toserver-chunk-size: 2560
    toclient-chunk-size: 2560

To detect the potential issue with memcap, one can read the ‘stats.log’ file
which contains various counters. Some of them matching the ‘memcap’ string.

Running suricata

Suricata can now be runned with the usual command line

sudo suricata -c /etc/suricata.yaml --af-packet=eth3

Our affinity setup is working as planned as show the following log line

Setting prio -2 for "AFPacketeth34" Module to cpu/core 3, thread id 30415

Tests

Tests have been made by simply running Suricata against the massive traffic
mirrored on the eth3 interface.

At first, we started Suricata without rules to see if it was able to deal
with the amount of packets for a long period. Most of the tuning was done
during this phase.

To detect packet loss, the capture keyword can be search in ‘stats.log’.
If ‘kernel_drops’ is set to 0, this is good

capture.kernel_packets    | AFPacketeth315            | 1436331302
capture.kernel_drops      | AFPacketeth315            | 0
capture.kernel_packets    | AFPacketeth316            | 1449320230
capture.kernel_drops      | AFPacketeth316            | 0

The statistics are available for each thread. For example, ‘AFPacketeth315’ is
the 15th AFPacket thread bound to eth3.

When this phase was complete we did add some rules by using Emerging Threat PRO rules
for malware, trojan and some others:

rule-files:
 - trojan.rules
 - malware.rules
 - chat.rules
 - current_events.rules
 - dns.rules
 - mobile_malware.rules
 - scan.rules
 - user_agents.rules
 - web_server.rules
 - worm.rules

This ruleset has the following characterics:

  • 6719 signatures processed
  • 8 are IP-only rules
  • 2307 are inspecting packet payload
  • 5295 inspect application layer
  • 0 are decoder event only

This is thus a decent ruleset with a high part of application level event which require a
complex processing. With that ruleset, there is more than 16 alerts per second (output in unified2 format).

With the previously mentioned ruleset, the load of each CPU is around 60% and Suricata
is remaining stable during hours long run.

In most run, we’ve observed some packet loss between capture start and first time Suricata grab the statistics. It seems the initialization phase is not fast enough.

Conclusion

OISF team has access to the box for a week now and has already
managed to get real performance. We will continue to work on it to provide
the best possible experience to all Suricata’s users.

Feel free to made any remark and suggestion about this blog post and this setup.

Using AF_PACKET zero copy mode in Suricata

Victor Julien has just pushed a new feature to suricata’s git tree. It brings improvements to the AF_PACKET capture mode.

This capture mode can be used on Linux. It is the native way to capture packet. Suricata is able to use the interesting new multithreading feature provided by AF_PACKET on recent kernels: it is possible to have multiple capture threads receiving the packet of a single interface.

The commits add mmaped ring buffer support to AF_PACKET capture and also provide a zero copy mode. Mmaped ring buffer is mechanism similar to the one used by PF_RING. The kernel allocates some memory to store the packets and share this memory with the capture process. Instead of sending messages, the kernel just write to the shared memory and the process capture reads it. This is less consuming in term of CPU ressource and helps to increase the capture rate. But the main avantage of this technique is that the capture process can treat the packets without making a copy and this saves a lot of time

To activate this features, you need a Suricata compiled from latest git and you need to modify some entries in your suricata.yaml file. You have to tell suricata that you want to activate the mmap feature. For example to activate the feature on eth0, you have to add ‘use-mmap’ to your configuration:
[code]
af-packet:
– interface: eth0
use-mmap: yes
[/code]

You can then run Suricata with the command:

suricata -c suricata.yaml --af-packet=eth0

This setup will not activate the zero copy feature which is currently dependant of the running mode. You will need to activate the worker mode to enable zero copy. To do so, run Suricata with a command similar to this one:

suricata -c suricata.yaml --af-packet=eth0 --runmode=workers

This code should provide an interesting performance boost to the AF_PACKET capture system. I’ve no number to provide now but I will be happy to hear some if you make some tests