A month in the life of Debian in 2000 and 2012

Visualizing Debian packages upload

Ultimate Debian Database provide a way to get information about all packages upload on Debian repositories accros time. After a discussion with Lucas Nussbaum at Distro Recipes, he made available a webpage to access to a gource compatible file format of packages upload.

Using this I was able to create videos of Debian evolution over time. I’ve generated two videos showing on month of packages upload in 2000 and to compare one month in 2012.

The first video is really peaceful even if the lack of activity cause gource to do some jump in time:

The second video is made with exactly the same time scale and the rhythm is completely crazy:

More info about video generation

The raw data are the following: udd.gource.log.bz2. I’ve transformed them to add section information to package name by using the following script:

[python]
#!/usr/bin/python

import fileinput
import apt

cache = apt.Cache()

for line in fileinput.input():
[date, user, mode, package] = line.split(“|”)
pack = package.rstrip()

if len(user) == 0:
continue

try:
pkg = cache[pack] # Access the Package object for python-apt
package = pkg.section + “/” + pack
except KeyError:
package = “undef” + “/” + pack

print date + “|” + user + “|” + mode + “|” + package
[/python]

The result is the following file: udd.gource-section.log.bz2. Once extracted, it can be visualized in gource:

gource --log-format custom  udd.gource-section.log

Next step was to extract the upload at start (in 2000) and the latest upload (in 2012). I’ve simply used tail and head to do so. The generation of the videos was made using indication given on gource website:

gource -1920x1080 -o - udd.gource-end.log | ffmpeg -y -r 60 -f image2pipe -vcodec ppm -i - -vcodec libvpx -b 13000K debian-2012.webm
Eric Leblond: ulogd2, Netfilter logging reloaded

Introduction

I’ve made yesterday a presentation of ulogd2 at Open Source Days in Copenhagen. After a brief history of Netfilter logging, I’ve described the key features of ulogd2 and demonstrate two interfaces, nf3d and djedi.

The slides are available:
Ulogd2, Netfilter logging reloaded.

Screencasts

This video demonstrates some features of nf3d:

This screencast is showing some of the capabilities of djedi:

Thanks a lot to the organizers for this cool event.

Visualize Netfilter accounting in Graphite

Ulogd Graphite output plugin

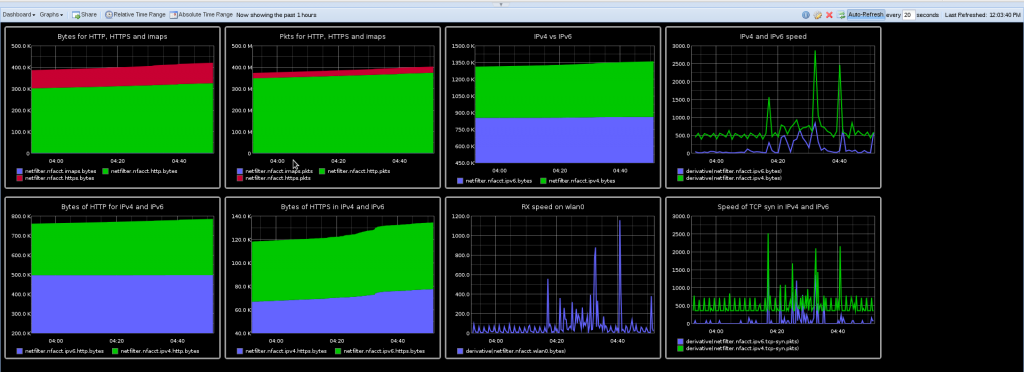
I’m committed a new output plugin for ulogd. The idea is to send NFACCT accounting data to a graphite server to be able to display the received data. Graphite is a web application which provide real-time visualization and storage of numeric time-series data.

Once data are sent to the graphite server, it is possible to use the web interface to setup different dashboard and graphs (including combination and mathematical operation):

Nfacct setup

One really interesting thing is that Graphite is using a tree hierarchy for data and this hierarchy is build by using a dot separator. So it really matches ulogd key system and on top of that nfacct can be used to create this hierarchy:

nfacct add ipv4.http
nfacct add ipv6.http

Once a counter is created in NFACCT it is instantly sent by ulogd to Graphite and can be used to create graph. To really use the counter, some iptables rules needs to be setup. To continue on previous example, we can use:

ip6tables -I INPUT -p tcp --sport 80 -m nfacct --nfacct-name ipv6.http
ip6tables -I OUTPUT -p tcp --dport 80 -m nfacct --nfacct-name ipv6.http
iptables -I INPUT -p tcp --sport 80 -m nfacct --nfacct-name ipv4.http
iptables -I OUTPUT -p tcp --dport 80 -m nfacct --nfacct-name ipv4.http

To save counters, you can use:

nfacct list >nfacct.dump

and you can restore them with:

nfacct restore <nfacct.dump

Ulogd setup

Ulogd setup is easy, simply add a new stack to ulogd.conf:

stack=acct1:NFACCT,graphite1:GRAPHITE

The configuration of NFACCT is simple, there is only one option which is the polling interval. The plugin will dump all nfacct counter at the given interval:

[acct1]
pollinterval = 2

The Graphite output module is easy to setup, you only need to specify the host and the port of the Graphite collector:

[graphite1]
host="127.0.0.1"
port="2003"