Suricata IDS/IPS architecture is heavily using multithreading. On almost every runmode (PCAP, PCAP file, NFQ, …) it is possible to setup the number of thread that are used for detection. This is the most CPU intensive task as it does the detection of alert by checking the packet on the signatures. The configuration of the number of threads is done by setting
a ratio which decide of the number of threads to be run by available CPUs (detect_thread_ratio variable).
A discussion with Florian Westphal at NFWS 2010 convince me that it was necessary for performance to tune with more granularity the thread and CPU link. I thus decide to improve this part of the code in Suricata and I’ve recently submitted a serie of patches that enable a fine setting.
I’ve been able to run some tests on a decent server:
processor       : 23

vendor_id       : GenuineIntel

cpu family      : 6

model           : 44

model name      : Intel(R) Xeon(R) CPU           X5650  @ 2.67GHz
This is a dual 6-core CPUs with hyperthreading activated and something like 12 Go of memory. From a Linux point of view, it has 24 identical processors.
I was not able to produce a decent testing environnement (read able to inject traffic) and all tests have been made on the parsing of a 6.1Go pcap file captured on a real network.
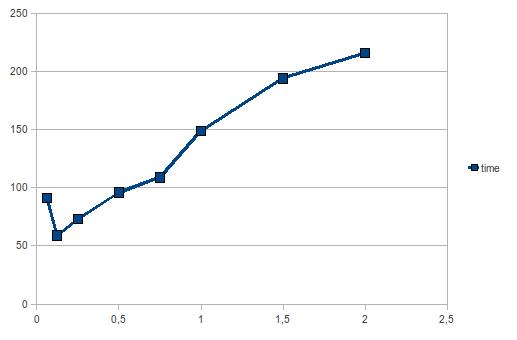
I’ve first tested my modification and soon arrive to the conclusion that limiting the number of threads was a good idea. Following Victor Julien suggestion, I’ve played with the detect_thread_ratio variable to see its influence on the performance. Here’s the graph of performance relatively to the ratio for the given server:
It seems that the 0.125 value (which correspond to 3 threads) is on this server the best value.
If we launch the test with ratio 0.125 more than one time, we can see that the performance vary between 64s and 50s with a mean of 59s. This means the variation is about 30% and the running can not be easily predicted.
It is now time to look at the results we can obtain by tuning the affinity. I’ve setup the following affinity configuration which run 3 threads on selected CPU (for our reader 3 = 0.125 * 24):
  cpu_affinity:
    - management_cpu_set:
        cpu: [ 0 ]  # include only these cpus in affinity settings
    - receive_cpu_set:
        cpu: [ 1 ]  # include only these cpus in affinity settings
    - decode_cpu_set:
        cpu: [ "2" ]
        mode: "balanced"
    - stream_cpu_set:
        cpu: [ "0-4" ]
    - detect_cpu_set:
        #cpu: [ 6, 7, 8 ]
        cpu: [ 6, 8, 10 ]
        #cpu: [ 6, 12, 18 ]
        mode: "exclusive" # run detect threads in these cpus
        threads: 3
        prio:
           low: [ "0-4" ]
           medium: [ "5-23" ]
           default: "medium"
    - verdict_cpu_set:
        cpu: [ 0 ]
        prio:
           default: "high"
    - reject_cpu_set:
        cpu: [ 0 ]
        prio:
           default: "low"
    - output_cpu_set:
        cpu: [ "0" ]
        prio:
           default: "medium"
and I’ve played with detect_cpu_set setting on the cpu variable. By using CPU set coherent with the hardware architecture, we manage to have result with a very small variation between run:
- All threads including receive one on the same CPU but avoiding hyperthread: 50-52s (detect threads running on 6,8,10)
- All threads on same CPU but without avoiding hyperthread: 60-62s (detect threads running on 6,7,8)
- All threads on same hard CPU: 55-57s (avoid hyperthread, 4 threads) (4 6 8 10 on detect)
- Read and detect on different CPU: 61-65s (detect threads on 6,12,18)
Thus we stabilize the best performance by remaining on the same hardware CPU and avoiding hyperthread CPUs. This also explain the difference between the run of the first tests. The only setting was the number of threads and we can encounter any of the setup (same or different hardware CPU, running two threads on a core with hyperthreading) or even flip during one test. That’s why performance vary a lot between tests run.
Next step for me will be to run perf tool on suricata to estimate where the bottleneck is. More infos to come !

thanks for this experiment. can you please tell me similar options to achieve higher performance