Slides of my nftables talk at Kernel Recipes

I’ve been lucky enough to do a talk during the third edition of Kernel Recipes. I’ve presented the evolution of nftables durig the previous year.

You can get the slides from here: 2014_kernel_recipes_nftables.

Thanks to Hupstream for uploading the video of the talk:


Not much material but this slides and a video of the work done during the previous year on nftables and its components:


Using DOM with nftables

DOM and SSH honeypot

DOM is a solution comparable to fail2ban but it uses Suricata SSH log instead of SSH server logs. The goal of DOM is to redirect the attacker based on its SSH client version. This allows to send attacker to a honeypot like pshitt directly after the first attempt. And this can be done for a whole network as Suricata does not need to be on the targeted box.

Using DOM with nftables

I’ve pushed a basic nftables support to DOM. Instead of adding element via ipset it uses a nftables set.

It is simple to use it as you just need to add a -n flag to specify which table the set has been defined in:

./dom -f /usr/local/var/log/suricata/eve.json -n nat -s libssh -vvv -i -m OpenSSH

To activate the network address translation based on the set, you can use something like:

table ip nat {
        set libssh { 
                type ipv4_addr
        }

        chain prerouting {
                 type nat hook prerouting priority -150;
                 ip saddr @libssh ip protocol tcp counter dnat 192.168.1.1:2200
        }
}

A complete basic ruleset

Here’s the ruleset running on the box implementing pshitt and DOM:

table inet filter {
        chain input {
                 type filter hook input priority 0;
                 ct state established,related accept
                 iif lo accept
                 ct state new iif != lo tcp dport {ssh, 2200} tcp flags == syn counter log prefix "SSH attempt" group 1 accept
                 iif br0 ip daddr 224.2.2.4 accept
                 ip saddr 192.168.0.0/24 tcp dport {9300, 3142} counter accept
                 ip saddr 192.168.1.0/24 counter accept
                 counter log prefix "Input Default DROP" group 2 drop
        }
}

table ip nat {
        set libssh { 
                type ipv4_addr
        }

        chain prerouting {
                 type nat hook prerouting priority -150;
                 ip saddr @libssh ip protocol tcp counter dnat 192.168.1.1:2200
        }

        chain postrouting {
                 type nat hook postrouting priority -150;
                 ip saddr 192.168.0.0/24 snat 192.168.1.1
        }
}

There is a interesting rule in this ruleset. The first is:

ct state new iif != lo tcp dport {ssh, 2200} tcp flags == syn counter log prefix "SSH attempt" group 1 accept

It uses a negative construction to match on the interface iif != lo which means interface is not lo. Note that it also uses an unamed set to define the port list via tcp dport {ssh, 2200}. That way we have one single rule for normal and honeypot ssh. At least, this rule is logging and accepting and the logging is done via nfnetlink_log because of the group parameter. This allows to have ulogd to capture log message triggered by this rule.

pshitt: collect passwords used in SSH bruteforce

Introduction

I’ve been playing lately on analysis SSH bruteforce caracterization. I was a bit frustrated of just getting partial information:

  • ulogd can give information about scanner settings
  • suricata can give me information about software version
  • sshd server logs shows username

But having username without having the password is really frustrating.

So I decided to try to get them. Looking for a SSH server honeypot, I did find kippo but it was going too far for me
by providing a fake shell access. So I’ve decided to build my own based on paramiko.

pshitt, Passwords of SSH Intruders Transferred to Text, was born. It is a lightweight fake SSH server that collect authentication data sent by intruders. It basically collects username and password and writes the extracted data to a file in JSON format. For each authentication attempt, pshitt is dumping a JSON formatted entry:

{"username": "admin", "src_ip": "116.10.191.236", "password": "passw0rd", "src_port": 36221, "timestamp": "2014-06-26T10:48:05.799316"}

The data can then be easily imported in Logstash (see pshitt README) or Splunk.

The setup

As I want to really connect to the box running ssh with a regular client, I needed a setup to automatically redirect the offenders and only them to pshitt server. A simple solution was to used DOM. DOM parses Suricata EVE JSON log file in which Suricata gives us the software version of IP connecting to the SSH server. If DOM sees a
software version containing libssh, it adds the originating IP to an ipset set.

So, the idea of our honeypot setup is simple:

  • Suricata outputs SSH software version to EVE
  • DOM adds IP using libssh to the ipset set
  • Netfilter NAT redirects all IP off the set to pshitt when they try to connect to our ssh server

Getting the setup in place is really easy. We first create the set:

ipset create libssh hash:ip

then we start DOM so it adds all offenders to the set named libssh:

cd DOM
./dom -f /usr/local/var/log/suricata/eve.json -s libssh

A more accurate setup for dom can be the following. If you know that your legitimate client are only based on OpenSSH then you can
run dom to put in the list all IP that do not (-i) use an OpenSSH client (-m OpenSSh):

./dom -f /usr/local/var/log/suricata/eve.json -s libssh -vvv -i -m OpenSSH

If we want to list the elements of the set, we can use:

ipset list libssh

Now, we can start pshitt:

cd pshitt
./pshitt

And finally we redirect the connection coming from IP of the libssh set to the port 2200:

iptables -A PREROUTING -m set --match-set libssh src -t nat -i eth0 -p tcp -m tcp --dport 22 -j REDIRECT --to-ports 2200

Some results

Here’s an extract of the most used passwords when trying to get access to the root account:

real root passwords

And here’s the same thing for the admin account attempt:

Root passwords

Both data show around 24 hours of attempts on an anonymous box.

Conclusion

Thanks to paramiko, it was really fast to code pshitt. I’m now collecting data and I think that they will help to improve the categorization of SSH bruteforce tools.

Let’s talk about SELKS

The slides of my lightning talk at SSTIC are available: Let’s talk about SELKS. The slides are in French and are intended to be humorous.

The presentation is about defensive security that needs to get sexier. And Suricata 2.0 with EVE logging combined with Elasticsearch and Kibana can really help to reach that target. If you want to try Suricata and Elasticsearch, you can download and test SELKS.

selks

The talk also present a small tool named Deny On Monitoring which demonstrate how easy it is to extract information from Suricata EVE JSON logging.

Slides of my coccigrep lightning talk at HES2014

I’ve gave a lightning talk about coccigrep at Hackito Ergo Sum to show how it can be used to search in code during audit or hacking party. Here are the slides: coccigrep: a semantic grep for the C language.

The slides of my talk Suricata 2.0, Netfilter and the PRC will soon be available on Stamus Networks website.

Logging connection tracking event with ulogd

Motivation

I’ve recently met @aurelsec and we’ve discussed about the interest of logging connection tracking entries. This is indeed a undervalued information source in a network.

Quoting Wikipedia: “Connection tracking allows the kernel to keep track of all logical network connections or sessions, and thereby relate all of the packets which may make up that connection. NAT relies on this information to translate all related packets in the same way, and iptables can use this information to act as a stateful firewall.”

Connection tracking being linked with Network Address Translation has a direct impact: it stores both side of each connection. If we use conntrack tool from conntrack-tools to list connections:

# conntrack  -L
tcp      6 431999 ESTABLISHED src=192.168.1.129 dst=19.1.16.7 sport=53400 dport=443 src=19.1.16.7 dst=1.2.3.4 sport=443 dport=53500 [ASSURED] mark=0 use=1
...

We have the two sides of a connection:

  • Orig: here 192.168.1.129:53400 to 19.1.16.7:443. This is the packet information as seen by the firewall when it reaches him. There is no translation at all.
  • Reply: here 19.1.16.7:443 to 1.2.3.4:53500. This is how will look like a answer coming from the server. The destination has been changed to the public IP of the firewall (here 1.2.3.4). And there is also a change of the destination port to the one used by the firewall when doing the initial mapping. In fact, as multiple client could use the same port at the same time, the firewall may have to rewrite the initial source port.

So the connection tracking stores all NAT transformations. This information is important because this is the only way to know which IP in a private network is responsible of something in the outside world. For example, let’s suppose that 19.1.16.7 has been attacked by our internal client (here 192.168.1.129). If the admin of this server sees the attack, it will only see the 1.2.3.4 IP address and port source 53500. If an authority asks you for the IP address responsible in your internal network you have no instrument but the conntrack to know that this was in fact 192.168.1.129.

That’s why logging connection tracking event is one of the only effective way to store the information necessary to get back to the internal IP address in case of external query. Let’s now do this with ulogd 2.

Ulogd setup

Ulogd installation

Ulogd 2 is able to get information from the connection tracking and to log them in files or database.
If your distribution is not providing ulogd and if you don’t know how to install it, you can check this post Using ulogd and JSON output.
To be sure that you will be able to log connection tracking event, you need to have NFCT plugin to yes at the end of configure output.

Ulogd configuration:
  Input plugins:
    NFLOG plugin:			yes
    NFCT plugin:			yes

Kernel setup

All functionalities are standard since kernel 2.6.14. You only need to load the following module:

modprobe nf_conntrack_netlink

It is the one in charge of kernel and userspace information exchange regarding connection tracking.
It provides features to dump the conntrack table or modify entries in the conntrack. For example the conntrack tool mentioned before is using that communication method to get the listing of connection tracking entries. But the feature that interest us in ulogd is the event mode. For each event in the life of a connection, a message is sent to the userspace. Ulogd is able to listen to these messages and this gives it the ability to store all information on the life of the connection in connection tracking.

Depending on the protocol you have on your network, you may need to run on of the following:

modprobe nf_conntrack_ipv4
modprobe nf_conntrack_ipv6

Ulogd setup

Our first objective will simply be to log all NAT decisions to a syslog-like file on disk. In term of connection tracking, this means we will log all connection in the NEW state. This way we will get information about any packet going through the firewall with the associated NAT transformation.

If you install from sources, copy ulogd.conf at the root of ulogd sources to your config directory (usually /usr/local/etc/. And start your favorite editor on it.

Ulogd is doing logging based on stack definition. A stack is one chain of plugins starting from a input plugin, finishing with an output one, and with filter in the middle. In our case, we want to get packet from Netfilter conntrack and the corresponding plugin is NFCT. The first example of stack containing NFCT in the ulogd.conf file is the one we are interested in, so we uncomment it:

stack=ct1:NFCT,ip2str1:IP2STR,print1:PRINTFLOW,emu1:LOGEMU

We are not sure that the setup of input and output plugin will be correct. For now, let’s just check the output:

[emu1]
file="/var/log/ulogd_syslogemu.log"
sync=1

As you may have seen, emu1 is also used by packet logging. So it may be a good idea that we have our own output file for connection tracking event.
To do that, we update the stack:

stack=ct1:NFCT,ip2str1:IP2STR,print1:PRINTFLOW,emunfct1:LOGEMU

and create a new config below emu1:

[emunfct1]
file="/var/log/ulogd_nfct.log"
sync=1

We have changed file name and keep the sync option which permit to avoid the a delay in write due to buffering effect during write which can be very annoying when debugging a setup.

Now, we can test:

ulogd -v

In /var/log/ulogd_nfct.log, we see things like

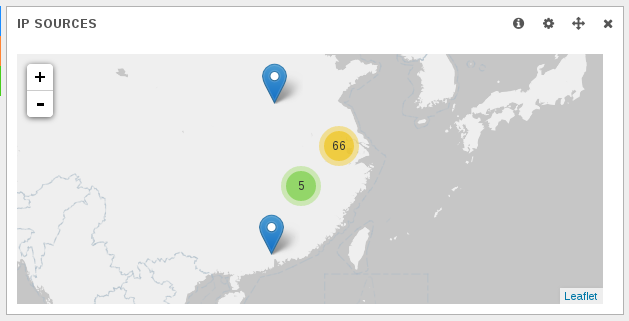
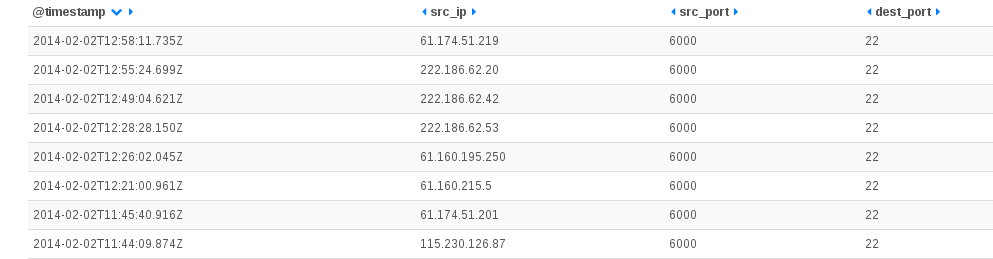
Feb 22 10:50:36 ice-age2 [DESTROY] ORIG: SRC=61.174.51.209 DST=192.168.1.129 PROTO=TCP SPT=6000 DPT=22 PKTS=0 BYTES=0 , REPLY: SRC=192.168.1.129 DST=61.174.51.209 PROTO=TCP SPT=22 DPT=6000 PKTS=0 BYTES=0

So we only have destruction messages. This is not exactly what we wanted to have. We are interested in NEW message that will allow us to have a correct timing of the event. Reading ulogd.conf file, it seems there is no information about chossing the event types. But let’s ask to the NFCT input plugin its capabilities. To do that we use option -i of ulogd:

# ulogd -v -i /usr/local/lib/ulogd/ulogd_inpflow_NFCT.so 
Name: NFCT
Config options:
        Var: pollinterval (Integer, Default: 0)
        Var: hash_enable (Integer, Default: 1)
        Var: hash_buckets (Integer, Default: 8192)
        Var: hash_max_entries (Integer, Default: 32768)
        Var: event_mask (Integer, Default: 5)
        Var: netlink_socket_buffer_size (Integer, Default: 0)
        Var: netlink_socket_buffer_maxsize (Integer, Default: 0)
        Var: netlink_resync_timeout (Integer, Default: 60)
        Var: reliable (Integer, Default: 0)
        Var: accept_src_filter (String, Default: )
        Var: accept_dst_filter (String, Default: )
        Var: accept_proto_filter (String, Default: )
...

The listing start with the configuration keys. One of them is event_mask. This is a the one controlling which events are sent from kernel to userspace.
The value is a mask combining some of the following values:

  • NF_NETLINK_CONNTRACK_NEW: 0x00000001
  • NF_NETLINK_CONNTRACK_UPDATE: 0x00000002
  • NF_NETLINK_CONNTRACK_DESTROY: 0x00000004

So default value of 5 is to listen to NEW and DESTROY events.
Clever reader will then ask: why did we only see DESTROY messages in that case. This is because ulogd NFCT plugin is running by default in hash_enable mode. In this mode, one single message is output for each connection (at end) and a hash is maintained in the kernel to store the info (here initial timestamp of the connection).
Our setup don’t need this feature because we only want to get the NAT transformation so we switch the hash feature off and limit the events to NEW:

[ct1]
event_mask=0x00000001
hash_enable=0

We can now restart ulogd and check the log file:

Feb 22 11:59:34 ice-age2 [NEW] ORIG: SRC=2a01:e35:1394:5bd0:da50:b6ff:fe3c:4250 DST=2001:41d0:1:9598::1 PROTO=TCP SPT=51162 DPT=22 PKTS=0 BYTES=0 , REPLY: SRC=2001:41d0:1:9598::1 DST=2a01:e35:1394:5bd0:da50:b6ff:fe3c:4250 PROTO=TCP SPT=22 DPT=51162 PKTS=0 BYTES=0
Feb 22 11:59:43 ice-age2 [NEW] ORIG: SRC=192.168.1.129 DST=68.232.35.139 PROTO=TCP SPT=60846 DPT=443 PKTS=0 BYTES=0 , REPLY: SRC=68.232.35.139 DST=1.2.3.4 PROTO=TCP SPT=443 DPT=60946 PKTS=0 BYTES=0

This is exactly what we wanted, we have a trace of all NAT transformation.

Maintain an history of connection tracking

Objective

We want to log all information describing a connection so we have a trace of what is going on the firewall. This means we need at least:

  • IP information for orig and reply way
  • Timestamp of start and end of connection
  • Bandwidth used by the connection
Kernel setup

By default, recent kernel have a limited handling of connection tracking. Some useful fields are not stored for performance reason. This is the case of the accounting (number of packets and bytes) and the case of the timestamp of the connection creation. The advantage of getting accounting information is trivial as you get information on bandwidth usage. Regarding timestamp, the interest is on implementation side. It allows ulogd to get all information needed for describing a connection in one single message (the DESTROY one). And ulogd does not need anymore to maintain a hash table to get the info and propagate it at exit.

To activate both features, you have to do:

 echo "1"> /proc/sys/net/netfilter/nf_conntrack_acct
 echo "1"> /proc/sys/net/netfilter/nf_conntrack_timestamp

Ulogd setup

For following setup, you will need ulogd build from git or a ulogd at a version superior or equal to 2.0.4.

Let’s first use JSON output to get the information in a readable format. We need to define a stack:

stack=ct2:NFCT,ip2str1:IP2STR,jsonnfct1:JSON

On ct2 side, we don’t want to use the hash and we only want to get DESTROY message, so our configuration looks like:

[ct2]
hash_enable=0
event_mask=0x00000004

Regarding, jsonnfct1 we could have reused the default JSON configuration but for ease of testing we will dedicate a file to the NFCT logging:

[jsonnfct1]
sync=1
file="/var/log/ulogd_nfct.json"

After a ulogd restart, we’ve got this type of entries:

{"reply.ip.daddr.str": "2a01:e35:1394:5ad0:da50:e6ff:fe3c:1250", "oob.protocol": 0, "dvc": "Netfilter", "timestamp": "Sat Feb 22 12:27:04 2014", "orig.ip.protocol": 6, "reply.raw.pktcount": 20, "flow.end.sec": 1393068424, "orig.l4.sport": 51384, "orig.l4.dport": 22, "orig.raw.pktlen": 5600, "ct.id": 1384991512, "orig.raw.pktcount": 23, "reply.raw.pktlen": 4328, "reply.ip.protocol": 6, "reply.l4.sport": 22, "reply.l4.dport": 51384, "ct.mark": 0, "ct.event": 4, "flow.start.sec": 1393068302, "flow.start.usec": 637516, "flow.end.usec": 403240, "reply.ip.saddr.str": "2001:41d0:1:9598::1", "oob.family": 10, "src_ip": "2a01:e35:1394:5ad0:da50:e6ff:fe3c:1250", "dest_ip": "2001:41d0:1:9598::1"}

The fields we wanted are here:

  • flow.start.* keys store the timestamp of flow start
  • flow.end.* keys store the end of the connection
  • *.raw.pkt* keys store the accounting information

You can then add this file to the file parsed by logstash. For that if you can use information from Using ulogd and JSON output and modify the input section:

input {
   file { 
      path => [ "/var/log/ulogd.json", "/var/log/ulogd_nfct.json"]
      codec =>   json 
   }
}

One interesting information in a connection tracking entry is the duration. But the field is not available in ulogd JSON output and it is not possible to do mathematical operations in Kibana. A solution to get the information is to add a filter in logstash.conf to compute the duration:

filter {
  if [type] == "json-log" {
    ruby {
      code => "if event['ct.id']; event['flow.duration.sec']=(event['flow.end.sec'].to_i - event['flow.start.sec'].to_i); end"
    }
  }
}

Screenshot from 2014-02-23 18:00:23
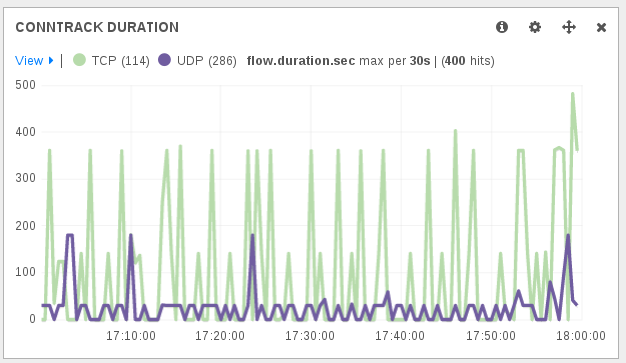
A thing to notice to understand the obtained duration is that a connection is dying following contextual timeout. For example, in the case of a TCP connection, even after a FIN packet there’s a timeout applied. So a short connection will at least be of the duration of the timeout.

An other logging method is PostgreSQL. The stack to use is almost the same as JSON one but use, as you may have guess, the PGSQL plugin:

stack=ct2:NFCT,ip2str1:IP2STR,pgsql2:PGSQL

The configuration of the PostgreSQL plugin is easy based on the setup available in the configuration:

[pgsql2]
db="nulog"
host="localhost"
user="nupik"
table="ulog2_ct"
#schema="public"
pass="changeme"
procedure="INSERT_CT"

I’m not the one who will explain how to connect to a PostgreSQL database and create a ulogd2 database. See Pollux post for that: ulogd2: the new userspace logging daemon for netfilter/iptables (part 2)

Other setup are possible. For example, you can maintain a copy of the connection tracking table in the database and also keep the history.
To do that you need to use the INSERT_OR_REPLACE_CT procedure and a connection tracking INPUT plugin not using the hash table but getting NEW and DESTROY events:

stack=ct2:NFCT,ip2str1:IP2STR,pgsql2:PGSQL

[ct2]
hash_enable=0

[pgsql2]
db="nulog"
host="localhost"
user="nupik"
table="ulog2_ct"
#schema="public"
pass="changeme"
procedure="INSERT_OR_REPLACE_CT"

Connection will be inserted in the table when getting the NEW event and the connection entry in the database will be updated when the DESTROY message will be received.

Using ulogd and JSON output

Ulogd and JSON output

In February 2014, I’ve commited a new output plugin to ulogd, the userspace logging daemon for Netfilter. This is a JSON output plugin which output logs into a file in JSON format. The interest of the JSON format is that it is easily parsed by software just as logstash. And once data are understood by logstash, you can get some nice and useful dashboard in Kibana:

Screenshot from 2014-02-02 13:22:34

This post explains how to configure ulogd and iptables to do packet logging and differentiate accepted and blocked packets. If you want to see how cool is the result, just check my post: Investigation on an attack tool used in China.

Installation

At the time of this writing, the JSON output plugin for ulogd is only available in the git tree. Ulogd 2.0.4 will contain the feature.

If you need to get the source, you can do:

git clone git://git.netfilter.org/ulogd2

Then the build is standard:

./autogen.sh
./configure
make
sudo make install

Please note that at the end of the configure, you must see:

Ulogd configuration:
  Input plugins:
    NFLOG plugin:			yes
...
    NFACCT plugin:			yes
  Output plugins:
    PCAP plugin:			yes
...
    JSON plugin:			yes

If the JSON plugin is not build, you need to install libjansson devel files on your system and rerun configure.

Configuration

Ulogd configuration

All the edits are made in the ulogd.conf file. With default configure option the file is in /usr/local/etc/.

First, you need to activate the JSON plugin:

plugin="/home/eric/builds/ulogd/lib/ulogd/ulogd_output_JSON.so"

Then we define two stacks for logging. It will be used to differentiate accepted packets from dropped packets:

stack=log2:NFLOG,base1:BASE,ifi1:IFINDEX,ip2str1:IP2STR,mac2str1:HWHDR,json1:JSON
stack=log3:NFLOG,base1:BASE,ifi1:IFINDEX,ip2str1:IP2STR,mac2str1:HWHDR,json1:JSON

The first stack will be used to log accepted packet, so we the numeric_label to 1 in set in [log2].
In [log3], we use a numeric_label of 0.

[log2]
group=1 # Group has to be different from the one use in log1
numeric_label=1

[log3]
group=2 # Group has to be different from the one use in log1/log2
numeric_label=0 # you can label the log info based on the packet verdict

The last thing to edit is the configuration of the JSON instance:

[json1]
sync=1
device="My awesome FW"
boolean_label=1

Here we say we want log and write on disk configuration (via sync) and we named our device My awesome FW.
Last value boolean_label is the most tricky. It this configuration variable is set to 1, the numeric_label will
be used to decide if a packet has been accepted or blocked. It this variable is set non null, then the packet is seen as allowed.
If not, then it is seen as blocked.

Sample Iptables rules

In this example, packets to port 22 are logged and accepted and thus are logged in nflog-group 1. Packet in the default drop rule are sent to group 2 because they are dropped.

iptables -A INPUT -m state --state RELATED,ESTABLISHED -j ACCEPT
iptables -A INPUT ! -i lo -p tcp -m tcp --dport 22 --tcp-flags FIN,SYN,RST,ACK SYN -m state --state NEW -j NFLOG --nflog-prefix  "SSH Attempt" --nflog-group 1
iptables -A INPUT -i lo -j ACCEPT
iptables -A INPUT -p tcp -m tcp --dport 22 -m state --state NEW -j ACCEPT
iptables -A INPUT -j NFLOG --nflog-prefix  "Input IPv4 Default DROP" --nflog-group 2

There is no difference in IPv6, we just use nflog-group 1 and 2 with the same purpose:

ip6tables -A INPUT -m state --state RELATED,ESTABLISHED -j ACCEPT
ip6tables -A INPUT ! -i lo -p tcp -m tcp --dport 22 --tcp-flags FIN,SYN,RST,ACK SYN -m state --state NEW -j NFLOG --nflog-prefix  "SSH Attempt" --nflog-group 1
ip6tables -A INPUT ! -i lo -p ipv6-icmp -m icmp6 --icmpv6-type 128 -m state --state NEW -j NFLOG --nflog-prefix  "Input ICMPv6" --nflog-group 1
ip6tables -A INPUT -p ipv6-icmp -j ACCEPT
ip6tables -A INPUT -p tcp -m tcp --dport 22 -m state --state NEW -j ACCEPT
ip6tables -A INPUT -i lo -j ACCEPT
ip6tables -A INPUT -j NFLOG --nflog-prefix  "Input IPv6 Default DROP" --nflog-group 2

Logstash configuration

Logstash configuration is simple. You must simply declare the ulogd.json file as input and optionaly you can activate geoip on the src_ip key:

input {
   file { 
      path => [ "/var/log/ulogd.json"]
      codec =>   json 
   }
}

filter {
  if [src_ip]  {
    geoip {
      source => "src_ip"
      target => "geoip"
      add_field => [ "[geoip][coordinates]", "%{[geoip][longitude]}" ]
      add_field => [ "[geoip][coordinates]", "%{[geoip][latitude]}"  ]
    }
    mutate {
      convert => [ "[geoip][coordinates]", "float" ]
    }
  }
}

output { 
  stdout { codec => rubydebug }
  elasticsearch { embedded => true }
}

Usage

To start ulogd in daemon mode, simply run:

ulogd -d

You can download logstash from their website and start it with the following command line:

java -jar logstash-1.3.3-flatjar.jar agent -f etc/logstash.conf --log log/logstash-indexer.out -- web

Once done, just point your browser to localhost:9292 and enjoy nice and interesting graphs.

Screenshot from 2014-02-02 13:57:19

Investigation on an attack tool used in China

Log analysis experiment

I’ve been playing lately with logstash using data from the ulogd JSON output plugin and the Suricata full JSON output as well as standard system logs.

Screenshot from 2014-02-02 13:22:34

Ulogd is getting Netfilter firewall logs from Linux kernel and is writing them in JSON format. Suricata is doing the same with alert and other traces. Logstash is getting both log as well as sytem log. This allows to create some dashboard with information coming from multiple sources. If you want to know how to configure ulogd for JSON output check this post. For suricata, you can have a look at this one.

Ulogd output is really new and I was experimenting with it in Kibana. When adding some custom graphs, I’ve observed some strange things and decided to investigate.

Displaying TCP window

TCP window size at the start of the connection is not defined in the RFC. So every OSes have choozen their own default value. It was thus looking interesting to display TCP window to be able to find some strange behavior. With the new ulogd JSON plugin, the window size information is available in the tcp.window key. So, after doing a query on tcp.syn:1 to only get TCP syn packet, I was able to graph the TCP window size of SYN packets.

Screenshot from 2014-02-02 13:22:58

Most of the TCP window sizes are well-known and correspond to standard operating systems:

  • 65535 is or MacOSX or some MS Windows OS.
  • 14600 is used by some Linux.

The first uncommon value is 16384. Graph are clickable on Kibana, so I was at one click of some interesting information.

First information when looking at dashboard after selection TCP syn packet with a window size of 16384 was the fact, it was only ssh scanning:

Screenshot from 2014-02-02 13:58:15

Second information is the fact that, according to geoip, all IPs are chinese:

Screenshot from 2014-02-02 13:57:19

A SSH scanning software

When looking at the details of the attempt made on my IP, there was something interesting:
Screenshot from 2014-02-02 14:04:32

For all hosts, all requests are done with the same source port (6000). This is not possible to do that with a standard ssh client where the source port is by default choosen by the operating system. So or we have a custom standard software that perform a bind operation to port 6000 at socket creation. This is possible and one advantage would be to be easily authorized through a firewall if the country had one. Or we could have a software developped with low level (RAW) sockets for performance reason. This would allow a faster scanning of the internet by skipping OS TCP connection handling. There is a lot of posts regarding the usage of port 6000 as source for some scanning but I did not find any really interesting information in them.

On suricata side, most of the source IPs are referenced in ET compromised rules:

Screenshot from 2014-02-02 13:25:03

Analysing my SSH logs, I did not see any trace of ssh bruteforce coming from source port 6000. But when selecting an IP, I’ve got trace of brute force from at least one of the IP:

Screenshot from 2014-02-02 14:31:02

These attackers seems to really love the root account. In fact, I did not manage to find any trace of attempts for user different than root for IP address that are using the port 6000.

Getting back to my ulogd dashboard, I’ve displayed more info about the used scanning sequence:
Screenshot from 2014-02-02 14:34:05

The host scans the box using a scanner using raw socket, then it attacks with a few minutes later with SSH bruteforce tool. The bruteforce tool has a TCP window size at start of 65535. It indicates that a separated software is used for scanning. So we should have an queueing mechanism between the scanner and the bruteforce tool. This may explains the duration between the scan and the bruteforce. Regarding TCP window size value, 65535 seems to indicate a Windows server (which is coherent with TTL value).

Looking at the scanner traffic

Capturing a sample traffic did not give to much information. This is a scanner sending a SYN and cleanly sending a reset when it got the SYN, ACK:

14:27:54.982273 IP (tos 0x0, ttl 103, id 256, offset 0, flags [none], proto TCP (6), length 40)
    218.2.22.118.6000 > 192.168.1.19.22: Flags [S], cksum 0xa525 (correct), seq 9764864, win 16384, length 0
14:27:54.982314 IP (tos 0x0, ttl 64, id 0, offset 0, flags [DF], proto TCP (6), length 44)
    192.168.1.19.22 > 218.2.22.118.6000: Flags [S.], cksum 0xeee2 (correct), seq 2707606274, ack 9764865, win 29200, options [mss 1460], length 0
14:27:55.340992 IP (tos 0x0, ttl 111, id 14032, offset 0, flags [none], proto TCP (6), length 40)
    218.2.22.118.6000 > 192.168.1.19.22: Flags [R], cksum 0xe48c (correct), seq 9764865, win 0, length 0

But it seems the RST packet after the SYN, ACK is not well crafted:
Screenshot from 2014-02-02 16:07:26

More info on SSH bruteforce tool

Knowing the the behavior was scanning from 6000 and starting a normal scanning, I’ve focused the Suricata dashboard on one IP to see if I had some more information:

Screenshot from 2014-02-02 15:21:58

One single IP in the list of the scanning host is triggering multiple alerts. The event table confirmed this:
Screenshot from 2014-02-02 15:16:41

Studying the geographical repartition of the Libssh alert, it appears there is used in other countries than China:
Screenshot from 2014-02-02 15:24:59
So, libssh is not a discriminatory element of the attacks.

Conclusion

A custom attack tool has been been deployed on some Chinese IPs. This is a combination of a SSH scanner based on RAW socket and a SSH bruteforce tool. It tries to gain access to the root account of system via the ssh service. On an organisational level, it is possible there is a Chinese initiative trying to get the low-hanging fruit (system with ssh root account protected by password) or maybe it is just a some organization using some compromised Chinese IPs to try to get control other more boxes.

A bit of logstash cooking

Introduction

I’m running a dedicated server to host some internet services. The server runs Debian. I’ve installed logstash on it to do a bit of monitoring of my system logs and suricata.

I’ve build a set of dashboards. The screenshot below shows a part of the one being dedicated to suricata:
Suricata dashboard

Setup

My data sources were the following:

  • System logs
  • Apache logs
  • Suricata full JSON logs (should be available in suricata 2.0)
System logs

The setup was mostly really easy. I’ve just added a grok pattern to detect successful and unsuccessful connections on the ssh server.

input {
  file {
    type => "linux-syslog"
    path => [ "/var/log/daemon.log", "/var/log/auth.log", "/var/log/mail.info" ]
  }
filter {
  if [type] == "linux-syslog" {
      grok {
        match => { "message" => "Accepted %{WORD:auth_method} for %{USER:username} from %{IP:src_ip} port %{INT:src_port} ssh2" }
      }
      grok {
        match => { "message" => "Invalid user %{USER:username} from %{IP:src_ip}" }
      }
  }
}
Apache logs

Extract of Apache Dashboard

For apache, it was even easier for access.log:

  file {
    path => [ "/var/log/apache2/*access.log" ]
    type => "apache-access"
  }

  file {
    type => "apache-error"
    path => "/var/log/apache2/error.log"
  }
}
filter {
  if [type] == "apache-access" {
      grok {
        match => { "message" => "%{COMBINEDAPACHELOG}" }
      }
  }

  if [type] == "apache-error" {
      grok {
        match => { "message" => "%{APACHEERRORLOG}" }
        patterns_dir => ["/var/lib/logstash/etc/grok"]
      }
  }
}

For error log, I’ve created a grok pattern to get client IP. So I’ve created a file in grok dir with:

HTTPERRORDATE %{DAY} %{MONTH} %{MONTHDAY} %{TIME} %{YEAR}
APACHEERRORLOG \[%{HTTPERRORDATE:timestamp}\] \[%{WORD:severity}\] \[client %{IPORHOST:clientip}\] %{GREEDYDATA:message_remainder}
Netfilter logs

Extract of firewall Dashboard

For Netfilter logs, I’ve decided to play it the old way and to parse kernel log instead of using ulogd:

input {
  file {
    type => "kern-log"
    path => "/var/log/kern.log"
  }
}

filter {
 if [type] == "kern-log" {
        grok {
                match => { "message" => "%{IPTABLES}"}
                patterns_dir => ["/var/lib/logstash/etc/grok"]
        }
 }
}

with IPTABLES being defined in a file placed in the grok directory and containing:

 NETFILTERMAC %{COMMONMAC:dst_mac}:%{COMMONMAC:src_mac}:%{ETHTYPE:ethtype}
 ETHTYPE (?:(?:[A-Fa-f0-9]{2}):(?:[A-Fa-f0-9]{2}))
 IPTABLES1 (?:IN=%{WORD:in_device} OUT=(%{WORD:out_device})? MAC=%{NETFILTERMAC} SRC=%{IP:src_ip} DST=%{IP:dst_ip}.*(TTL=%{INT:ttl})?.*PROTO=%{WORD:proto}?.*SPT=%{INT:src_port}?.*DPT=%{INT:dst_port}?.*)
 IPTABLES2 (?:IN=%{WORD:in_device} OUT=(%{WORD:out_device})? MAC=%{NETFILTERMAC} SRC=%{IP:src_ip} DST=%{IP:dst_ip}.*(TTL=%{INT:ttl})?.*PROTO=%{INT:proto}?.*)
 IPTABLES (?:%{IPTABLES1}|%{IPTABLES2})

Exim logs

Extract of SMTP dashboard

This part was complicated because exim logs are multiline. So I found a page explaining how to match at least, the logs for delivered mail.
It is using multiline in filter.
Then I added a series of matches to get more information. Each match do only get a part of a message so I’ve used break_on_match not to exit
when one of the match succeed.

input {
  file {
    type => "exim-log"
    path => "/var/log/exim4/mainlog"
  }
}
filter {
  if [type] == "exim-log" {
      multiline {
        pattern => "%{DATE} %{TIME} %{HOSTNAME:msgid} (=>|Completed)"
        what => "previous"
      }
      grok {
        break_on_match => false
        match => [
          "message", "<= %{NOTSPACE:from} H=%{NOTSPACE:server} \[%{IP:src_ip}\]"
        ]
      }
      grok {
        break_on_match => false
        match => [
          "message", "=> %{USERNAME:username} <%{NOTSPACE:dest}> R=%{WORD:transport}"
        ]
      }

      grok {
        break_on_match => false
        match => [
          "message", "=> %{NOTSPACE:dest} R=%{WORD:transport}"
        ]
     }
      grok {
        break_on_match => false
        match => [
          "message", "%{DATE} %{TIME} H=%{NOTSPACE:server}%{GREEDYDATA} \[%{IP:src_ip}\] F=<%{NOTSPACE:mail_to}> temporarily rejected RCPT <%{NOTSPACE:dest}>: greylisted"
        ]
      }
   }
}
Suricata

Pie with file types

Suricata full JSON output is JSON so the configuration in logstash is trivial:

input {
   file {
      path => ["/var/log/suricata/eve.json" ]
      codec =>   json
   }
}

You can download a sample Suricata Dashboard to use in in your logstash installation.

The full configuration

Below is the full configuration. There is only one thing which I did not mention. For most source IP, I use geoip to have an idea of the localisation of the IP.

input {
  file {
    type => "linux-syslog"
    path => [ "/var/log/daemon.log", "/var/log/auth.log", "/var/log/mail.info" ]
  }

  file {
    path => [ "/var/log/apache2/*access.log" ]
    type => "apache-access"
  }

  file {
    type => "apache-error"
    path => "/var/log/apache2/error.log"
  }

  file {
    type => "exim-log"
    path => "/var/log/exim4/mainlog"
  }

  file {
    type => "kern-log"
    path => "/var/log/kern.log"
  }

   file {
      path => ["/var/log/suricata/eve.json" ]
      codec =>   json
   }

}

filter {
  if [type] == "apache-access" {
      grok {
        match => { "message" => "%{COMBINEDAPACHELOG}" }
      }
  }
  if [type] == "linux-syslog" {
      grok {
        match => { "message" => "Accepted %{WORD:auth_method} for %{USER:username} from %{IP:src_ip} port %{INT:src_port} ssh2" }
      }
  }

  if [type] == "apache-error" {
      grok {
        match => { "message" => "%{APACHEERRORLOG}" }
        patterns_dir => ["/var/lib/logstash/etc/grok"]
      }
  }

  if [type] == "exim-log" {
      multiline {
        pattern => "%{DATE} %{TIME} %{HOSTNAME:msgid} (=>|Completed)"
        what => "previous"
      }
      grok {
        break_on_match => false
        match => [
          "message", "<= %{NOTSPACE:from} H=%{NOTSPACE:server} \[%{IP:src_ip}\]"
        ]
      }
      grok {
        break_on_match => false
        match => [
          "message", "=> %{USERNAME:username} <%{NOTSPACE:dest}> R=%{WORD:transport}"
        ]
      }

      grok {
        break_on_match => false
        match => [
          "message", "=> %{NOTSPACE:dest} R=%{WORD:transport}"
        ]
     }
      grok {
        break_on_match => false
        match => [
          "message", "%{DATE} %{TIME} H=%{NOTSPACE:server}%{GREEDYDATA} \[%{IP:src_ip}\] F=<%{NOTSPACE:mail_to}> temporarily rejected RCPT <%{NOTSPACE:dest}>: greylisted"
        ]
      }
   }

 if [type] == "kern-log" {
        grok {
                match => { "message" => "%{IPTABLES}"}
                patterns_dir => ["/var/lib/logstash/etc/grok"]
        }
 }

  if [src_ip]  {
    geoip {
      source => "src_ip"
      target => "geoip"
      add_field => [ "[geoip][coordinates]", "%{[geoip][longitude]}" ]
      add_field => [ "[geoip][coordinates]", "%{[geoip][latitude]}"  ]
    }
    mutate {
      convert => [ "[geoip][coordinates]", "float" ]
    }
  }

  if [clientip]  {
    geoip {
      source => "clientip"
      target => "geoip"
      add_field => [ "[geoip][coordinates]", "%{[geoip][longitude]}" ]
      add_field => [ "[geoip][coordinates]", "%{[geoip][latitude]}"  ]
    }
    mutate {
      convert => [ "[geoip][coordinates]", "float" ]
    }
  }

  if [srcip]  {
    geoip {
      source => "srcip"
      target => "geoip"
      add_field => [ "[geoip][coordinates]", "%{[geoip][longitude]}" ]
      add_field => [ "[geoip][coordinates]", "%{[geoip][latitude]}"  ]
    }
    mutate {
      convert => [ "[geoip][coordinates]", "float" ]
    }
  }
}

output {
  stdout { codec => rubydebug }
  elasticsearch { embedded => true }
}

Logstash and Suricata for the old guys

Introduction

logstash an opensource tool for managing events and logs. It is using elasticsearch for the storage and has a really nice interface named Kibana. One of the easiest to use entry format is JSON.

Suricata is an IDS/IPS which has some interesting logging features. Version 2.0 will feature a JSON export for all logging subsystem. It will then be possible to output in JSON format:

  • HTTP log
  • DNS log
  • TLS log
  • File log
  • IDS Alerts

For now, only File log is available in JSON format. This extract meta data from files transferred over HTTP.

Peter Manev has described how to connect Logstash Kibana and Suricata JSON output. Installation is really simple, just download logstash from logstash website, write your configuration file and start the thing.

Kibana interface is really impressive:
Kibana Screenshot

But at the time, I started to look at the document, a few things were missing:

  • Geoip is not supported
  • All fields containing space appear as multiple entries

Geoip support

This one was easy. You simply have to edit the logstash.conf file to add a section about geoip:

input {
  file { 
    path => "/home/eric/builds/suricata/var/log/suricata/files-json.log" 
    codec =>   json 
    # This format tells logstash to expect 'logstash' json events from the file.
    #format => json_event 
  }
}

output { 
  stdout { codec => rubydebug }
  elasticsearch { embedded => true }
}

#geoip part
filter {
  if [srcip] {
    geoip {
      source => "srcip"
      target => "geoip"
      add_field => [ "[geoip][coordinates]", "%{[geoip][longitude]}" ]
      add_field => [ "[geoip][coordinates]", "%{[geoip][latitude]}"  ]
    }
    mutate {
      convert => [ "[geoip][coordinates]", "float" ]
    }
  }
}

It adds a filter that check for presence of srcip and add geoip information to the entry. The tricky thing is the add_field part that create an array that has to be used when adding a map to kibana dashboard. See following screenshot for explanation:
Creating new map in Kibana

You may have the following error:

You must specify 'database => ...' in your geoip filter"

In this case, you need to specify the path to the geoip database by adding the database keyword to geoip configuration:

#geoip part
filter {
  if [srcip] {
    geoip {
      source => "srcip"
      target => "geoip"
      database => "/path/to/GeoLiteCity.dat"
      add_field => [ "[geoip][coordinates]", "%{[geoip][longitude]}" ]
      add_field => [ "[geoip][coordinates]", "%{[geoip][latitude]}"  ]
    }
    mutate {
      convert => [ "[geoip][coordinates]", "float" ]
    }
  }
}

Once the file is written, you can start logstash

java -jar /home/eric/builds/logstash/logstash-1.2.2-flatjar.jar agent -f /home/eric/builds/logstash/logstash.conf --log /home/eric/builds/logstash/log/logstash-indexer.out -- web

See Logstash Kibana and Suricata JSON output for detailed information on setup.

Logstash indexing and mapping

Before logstash 1.3.1, fixing the space issue was really complex. Since that version, all indexed fields are provided with a .raw field that can be used to avoid the problem with spaces in name. So now, you can simply use in Kibana something like geoip.country_name.raw in the definition of graph instead of geoip.country_name. Doing that United States does not appear anymore as United and States.

Fixing the space issue for lostash previous to 1.3.1 was far more complicated for an old guy like me used to configuration files. If finding the origin of the behavior is easy fixing it was more painful. A simple googling shows me that by default elasticsearch storage split string at spaces when indexing. To fix this, you have to specify that the field should not be analyzed during indexing: "index":"not_analyzed"

That was looking easy at first but logstash is not using a configuration file for indexing and mapping. In fact, you need to interact with elasticsearch via HTTP requests. Second problem is that the index are dynamically generated, so there is a template system that you can use to have indexes created the way you want.

Creating an template is easy. You simply do something like:

curl -XPUT http://localhost:9200/_template/logstash_per_index -d '
{
    "template" : "logstash*",
    MAGIC HERE
}'

This will create a template that will be applied to all newly created indexes with name matching “logstash*”. The difficult part is to know what to to put in MAGIC HERE and to check if “logstash*” will match created index. To check this, you can retrieve all current mappings:

curl -XGET 'http://localhost:9200/_all/_mapping'

You then get a list of mappings and you can check the name. But best part is that you can get a base text to update the mapping definition part. With Suricata file log and geoip activated, the following configuration is working well:

curl -XPUT http://localhost:9200/_template/logstash_per_index -d '
{
    "template" : "logstash*",
    "mappings" : {
      "logs" : {
         "properties": {
            "@timestamp":{"type":"date",
            "format":"dateOptionalTime"},
            "@version":{"type":"string"},
            "dp":{"type":"long"},
            "dstip":{"type":"ip"},
            "filename":{"type":"string"},
            "geoip":{
               "properties":{
                  "area_code":{"type":"long"},
                  "city_name":{"type":"string", "index":"not_analyzed"},
                  "continent_code":{"type":"string"},
                  "coordinates":{"type":"string"},
                  "country_code2":{"type":"string"},
                  "country_code3":{"type":"string"},
                  "country_name":{"type":"string", "index":"not_analyzed"},
                  "dma_code":{"type":"long"},
                  "ip":{"type":"string"},
                  "latitude":{"type":"double"},
                  "longitude":{"type":"double"},
                  "postal_code":{"type":"string"},
                  "real_region_name":{"type":"string", "index":"not_analyzed"},
                  "region_name":{"type":"string", "index":"not_analyzed"},
                  "timezone":{"type":"string"}
               }
            },
            "host":{"type":"string"},
            "http_host":{"type":"string"},
            "http_referer":{"type":"string"},
            "http_uri":{"type":"string"},
            "http_user_agent":{"type":"string", "index":"not_analyzed", "omit_norms":true, "index_options":"docs"},
            "ipver":{"type":"long"},
            "magic":{"type":"string", "index":"not_analyzed", "omit_norms":true, "index_options":"docs"},
            "md5":{"type":"string"},
            "path":{"type":"string"},
            "protocol":{"type":"long"},
            "size":{"type":"long"},
            "sp":{"type":"long"},
            "srcip":{"type":"ip"},
            "state":{"type":"string"},
            "stored":{"type":"boolean"},
            "tags":{"type":"string"},
            "timestamp":{"type":"string"}
      }
    }
  }
}'

I’ve added some “index”:”not_analyzed” and improved the type for some of the fields. For example, srcip has been defined as an IP address. This allow to do range searching in Kibana like

["192.168.42.24" TO "192.168.42.45"]

Next point is to update the index format. To to so, you can get the name of current index, delete it and recreate it. To get the name you can use le mapping listing:

curl -XGET 'http://localhost:9200/_all/_mapping'

The return is something like:

{"logstash-2013.10.27":{"logs":{"properties":

So now, we can destroy this index named “logstash-2013.10.27” and have it recreated with the correct
settings:

curl -XDELETE 'http://localhost:9200/logstash-2013.10.27'
curl -XPUT 'http://localhost:9200/logstash-2013.10.27'

We need data to be reindexed so:

curl -XGET 'http://localhost:9200/logstash-2013.10.27/_refresh'

It may also be a good idea to wait for new data as it seems to trigger update in what elasticsearch is sending.