Introduction
I’m running a dedicated server to host some internet services. The server runs Debian. I’ve installed logstash on it to do a bit of monitoring of my system logs and suricata.
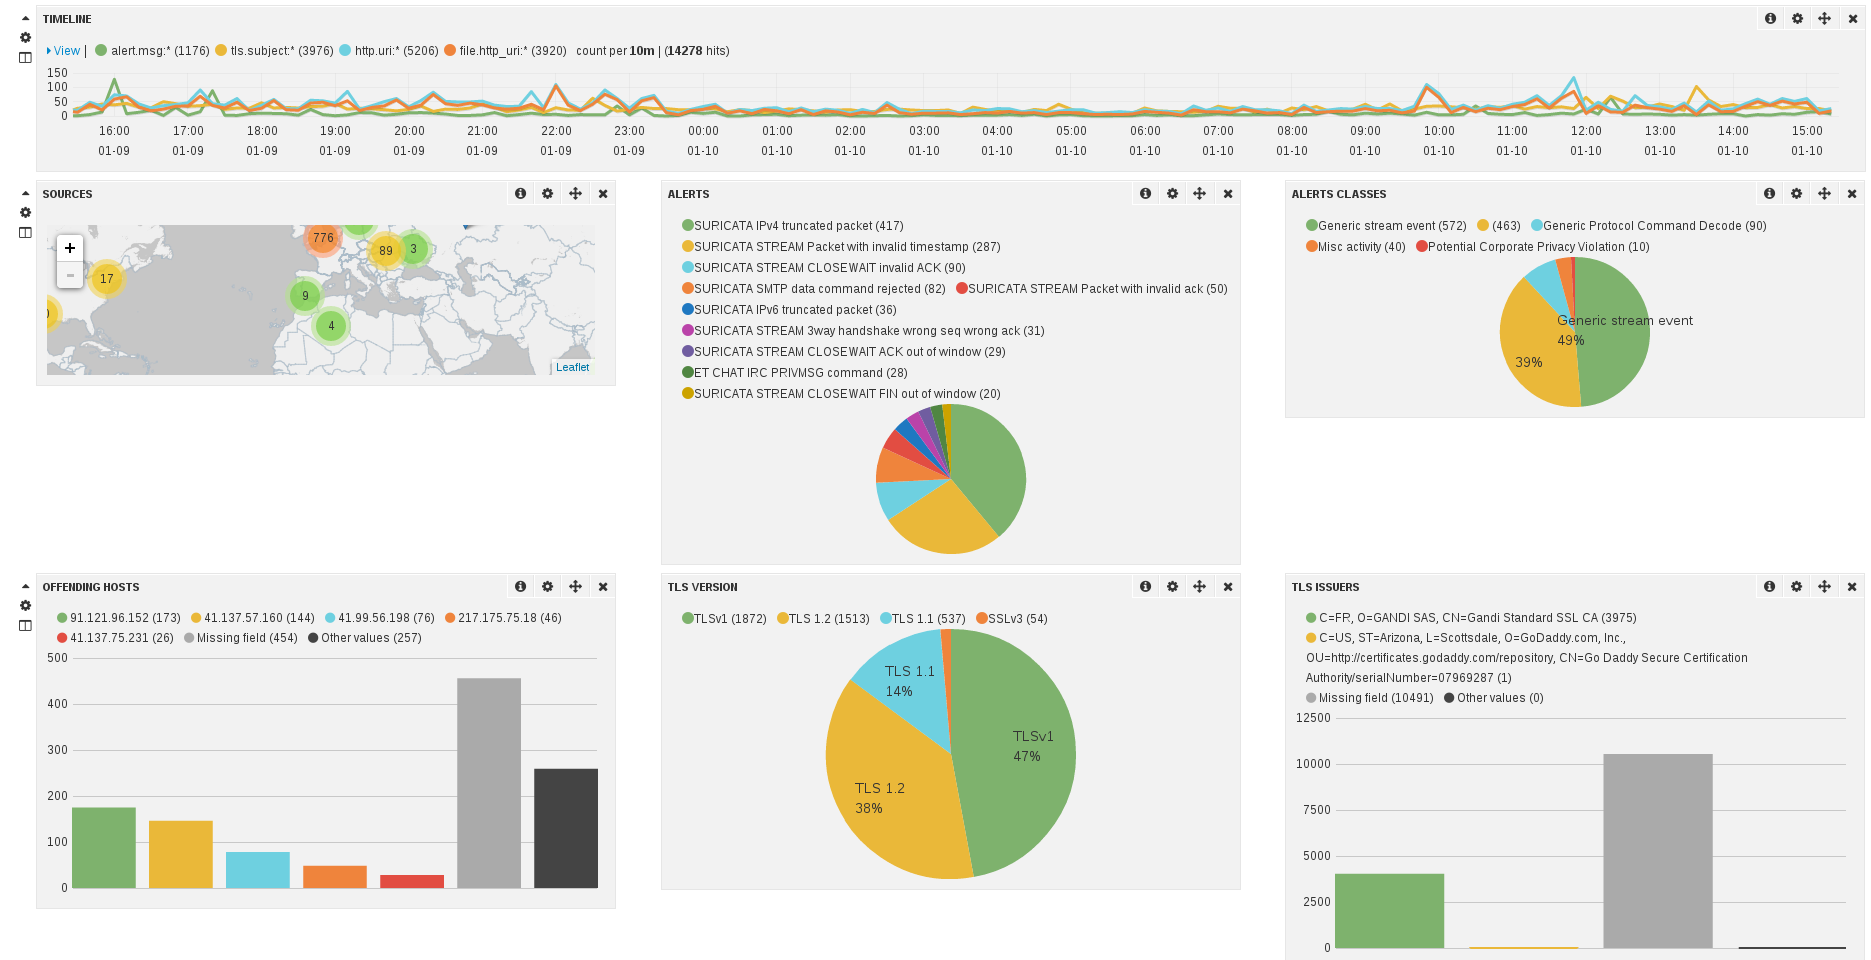
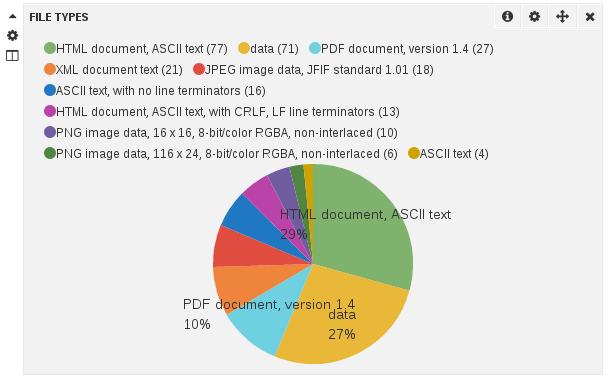
I’ve build a set of dashboards. The screenshot below shows a part of the one being dedicated to suricata:
Setup
My data sources were the following:
- System logs
- Apache logs
- Suricata full JSON logs (should be available in suricata 2.0)
System logs
The setup was mostly really easy. I’ve just added a grok pattern to detect successful and unsuccessful connections on the ssh server.
input {
  file {
    type => "linux-syslog"
    path => [ "/var/log/daemon.log", "/var/log/auth.log", "/var/log/mail.info" ]
  }
filter {
  if [type] == "linux-syslog" {
      grok {
        match => { "message" => "Accepted %{WORD:auth_method} for %{USER:username} from %{IP:src_ip} port %{INT:src_port} ssh2" }
      }
      grok {
        match => { "message" => "Invalid user %{USER:username} from %{IP:src_ip}" }
      }
  }
}
Apache logs
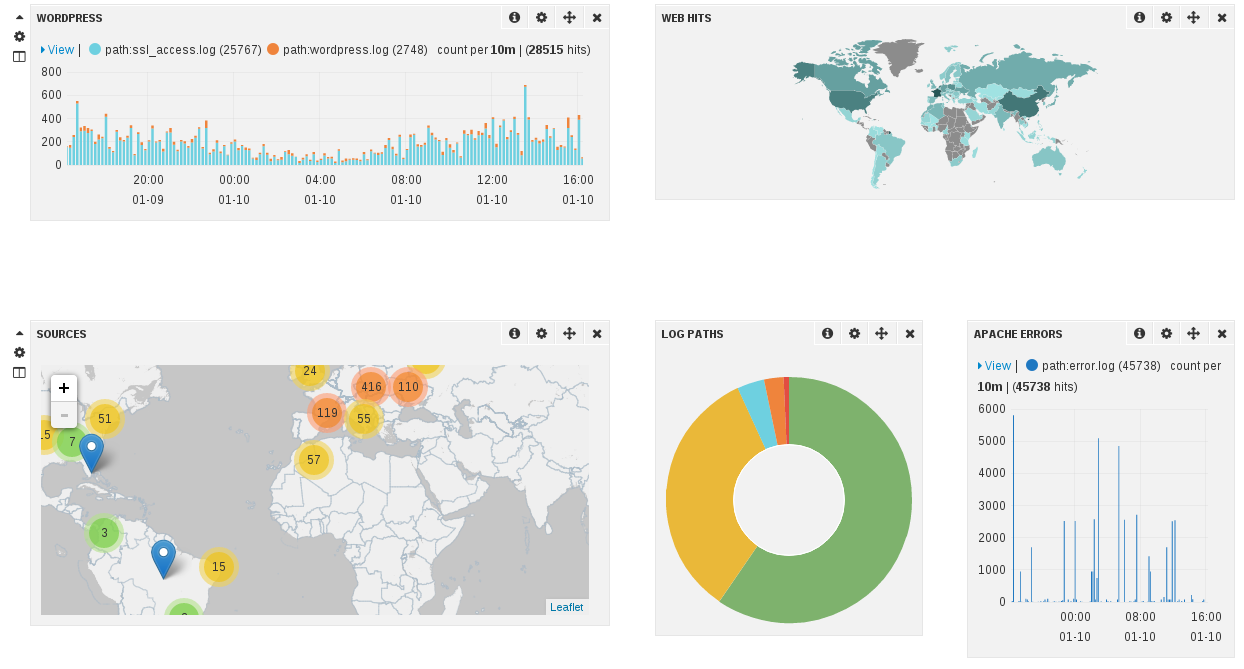
For apache, it was even easier for access.log:
  file {
    path => [ "/var/log/apache2/*access.log" ]
    type => "apache-access"
  }

  file {
    type => "apache-error"
    path => "/var/log/apache2/error.log"
  }
}
filter {
  if [type] == "apache-access" {
      grok {
        match => { "message" => "%{COMBINEDAPACHELOG}" }
      }
  }

  if [type] == "apache-error" {
      grok {
        match => { "message" => "%{APACHEERRORLOG}" }
        patterns_dir => ["/var/lib/logstash/etc/grok"]
      }
  }
}
For error log, I’ve created a grok pattern to get client IP. So I’ve created a file in grok dir with:
HTTPERRORDATE %{DAY} %{MONTH} %{MONTHDAY} %{TIME} %{YEAR}
APACHEERRORLOG \[%{HTTPERRORDATE:timestamp}\] \[%{WORD:severity}\] \[client %{IPORHOST:clientip}\] %{GREEDYDATA:message_remainder}
Netfilter logs
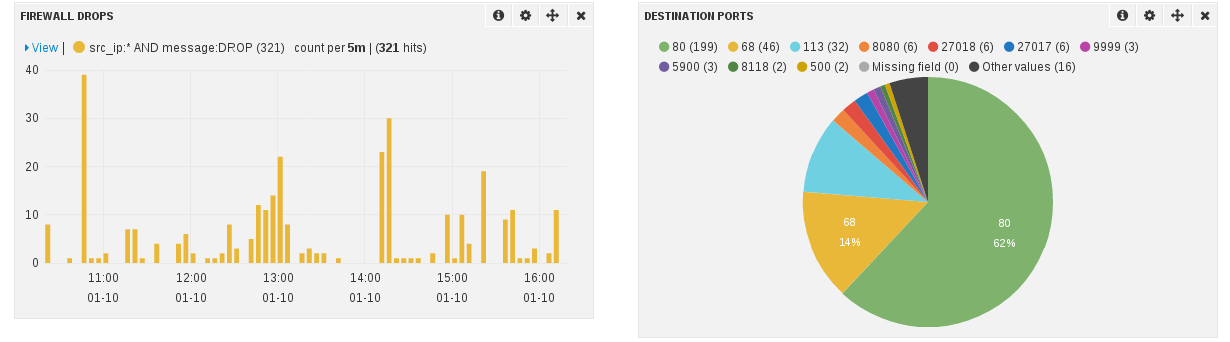
For Netfilter logs, I’ve decided to play it the old way and to parse kernel log instead of using ulogd:
input {
  file {
    type => "kern-log"
    path => "/var/log/kern.log"
  }
}

filter {
 if [type] == "kern-log" {
        grok {
                match => { "message" => "%{IPTABLES}"}
                patterns_dir => ["/var/lib/logstash/etc/grok"]
        }
 }
}
with IPTABLES being defined in a file placed in the grok directory and containing:
 NETFILTERMAC %{COMMONMAC:dst_mac}:%{COMMONMAC:src_mac}:%{ETHTYPE:ethtype}
 ETHTYPE (?:(?:[A-Fa-f0-9]{2}):(?:[A-Fa-f0-9]{2}))
 IPTABLES1 (?:IN=%{WORD:in_device} OUT=(%{WORD:out_device})? MAC=%{NETFILTERMAC} SRC=%{IP:src_ip} DST=%{IP:dst_ip}.*(TTL=%{INT:ttl})?.*PROTO=%{WORD:proto}?.*SPT=%{INT:src_port}?.*DPT=%{INT:dst_port}?.*)
 IPTABLES2 (?:IN=%{WORD:in_device} OUT=(%{WORD:out_device})? MAC=%{NETFILTERMAC} SRC=%{IP:src_ip} DST=%{IP:dst_ip}.*(TTL=%{INT:ttl})?.*PROTO=%{INT:proto}?.*)
 IPTABLES (?:%{IPTABLES1}|%{IPTABLES2})
Exim logs
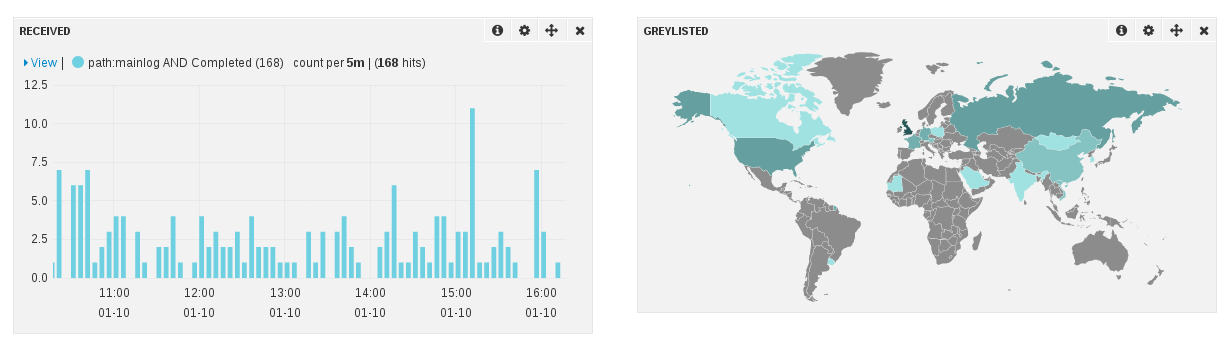
This part was complicated because exim logs are multiline. So I found a page explaining how to match at least, the logs for delivered mail.
It is using multiline in filter.
Then I added a series of matches to get more information. Each match do only get a part of a message so I’ve used break_on_match not to exit
when one of the match succeed.
input {
  file {
    type => "exim-log"
    path => "/var/log/exim4/mainlog"
  }
}
filter {
  if [type] == "exim-log" {
      multiline {
        pattern => "%{DATE} %{TIME} %{HOSTNAME:msgid} (=>|Completed)"
        what => "previous"
      }
      grok {
        break_on_match => false
        match => [
          "message", "<= %{NOTSPACE:from} H=%{NOTSPACE:server} \[%{IP:src_ip}\]"
        ]
      }
      grok {
        break_on_match => false
        match => [
          "message", "=> %{USERNAME:username} <%{NOTSPACE:dest}> R=%{WORD:transport}"
        ]
      }

      grok {
        break_on_match => false
        match => [
          "message", "=> %{NOTSPACE:dest} R=%{WORD:transport}"
        ]
     }
      grok {
        break_on_match => false
        match => [
          "message", "%{DATE} %{TIME} H=%{NOTSPACE:server}%{GREEDYDATA} \[%{IP:src_ip}\] F=<%{NOTSPACE:mail_to}> temporarily rejected RCPT <%{NOTSPACE:dest}>: greylisted"
        ]
      }
   }
}
Suricata
Suricata full JSON output is JSON so the configuration in logstash is trivial:
input {
   file {
      path => ["/var/log/suricata/eve.json" ]
      codec =>   json
   }
}
You can download a sample Suricata Dashboard to use in in your logstash installation.
The full configuration
Below is the full configuration. There is only one thing which I did not mention. For most source IP, I use geoip to have an idea of the localisation of the IP.
input {
  file {
    type => "linux-syslog"
    path => [ "/var/log/daemon.log", "/var/log/auth.log", "/var/log/mail.info" ]
  }

  file {
    path => [ "/var/log/apache2/*access.log" ]
    type => "apache-access"
  }

  file {
    type => "apache-error"
    path => "/var/log/apache2/error.log"
  }

  file {
    type => "exim-log"
    path => "/var/log/exim4/mainlog"
  }

  file {
    type => "kern-log"
    path => "/var/log/kern.log"
  }

   file {
      path => ["/var/log/suricata/eve.json" ]
      codec =>   json
   }

}

filter {
  if [type] == "apache-access" {
      grok {
        match => { "message" => "%{COMBINEDAPACHELOG}" }
      }
  }
  if [type] == "linux-syslog" {
      grok {
        match => { "message" => "Accepted %{WORD:auth_method} for %{USER:username} from %{IP:src_ip} port %{INT:src_port} ssh2" }
      }
  }

  if [type] == "apache-error" {
      grok {
        match => { "message" => "%{APACHEERRORLOG}" }
        patterns_dir => ["/var/lib/logstash/etc/grok"]
      }
  }

  if [type] == "exim-log" {
      multiline {
        pattern => "%{DATE} %{TIME} %{HOSTNAME:msgid} (=>|Completed)"
        what => "previous"
      }
      grok {
        break_on_match => false
        match => [
          "message", "<= %{NOTSPACE:from} H=%{NOTSPACE:server} \[%{IP:src_ip}\]"
        ]
      }
      grok {
        break_on_match => false
        match => [
          "message", "=> %{USERNAME:username} <%{NOTSPACE:dest}> R=%{WORD:transport}"
        ]
      }

      grok {
        break_on_match => false
        match => [
          "message", "=> %{NOTSPACE:dest} R=%{WORD:transport}"
        ]
     }
      grok {
        break_on_match => false
        match => [
          "message", "%{DATE} %{TIME} H=%{NOTSPACE:server}%{GREEDYDATA} \[%{IP:src_ip}\] F=<%{NOTSPACE:mail_to}> temporarily rejected RCPT <%{NOTSPACE:dest}>: greylisted"
        ]
      }
   }

 if [type] == "kern-log" {
        grok {
                match => { "message" => "%{IPTABLES}"}
                patterns_dir => ["/var/lib/logstash/etc/grok"]
        }
 }

  if [src_ip]  {
    geoip {
      source => "src_ip"
      target => "geoip"
      add_field => [ "[geoip][coordinates]", "%{[geoip][longitude]}" ]
      add_field => [ "[geoip][coordinates]", "%{[geoip][latitude]}"  ]
    }
    mutate {
      convert => [ "[geoip][coordinates]", "float" ]
    }
  }

  if [clientip]  {
    geoip {
      source => "clientip"
      target => "geoip"
      add_field => [ "[geoip][coordinates]", "%{[geoip][longitude]}" ]
      add_field => [ "[geoip][coordinates]", "%{[geoip][latitude]}"  ]
    }
    mutate {
      convert => [ "[geoip][coordinates]", "float" ]
    }
  }

  if [srcip]  {
    geoip {
      source => "srcip"
      target => "geoip"
      add_field => [ "[geoip][coordinates]", "%{[geoip][longitude]}" ]
      add_field => [ "[geoip][coordinates]", "%{[geoip][latitude]}"  ]
    }
    mutate {
      convert => [ "[geoip][coordinates]", "float" ]
    }
  }
}

output {
  stdout { codec => rubydebug }
  elasticsearch { embedded => true }
}