Introduction
I’m running a dedicated server to host some internet services. The server runs Debian. I’ve installed logstash on it to do a bit of monitoring of my system logs and suricata.
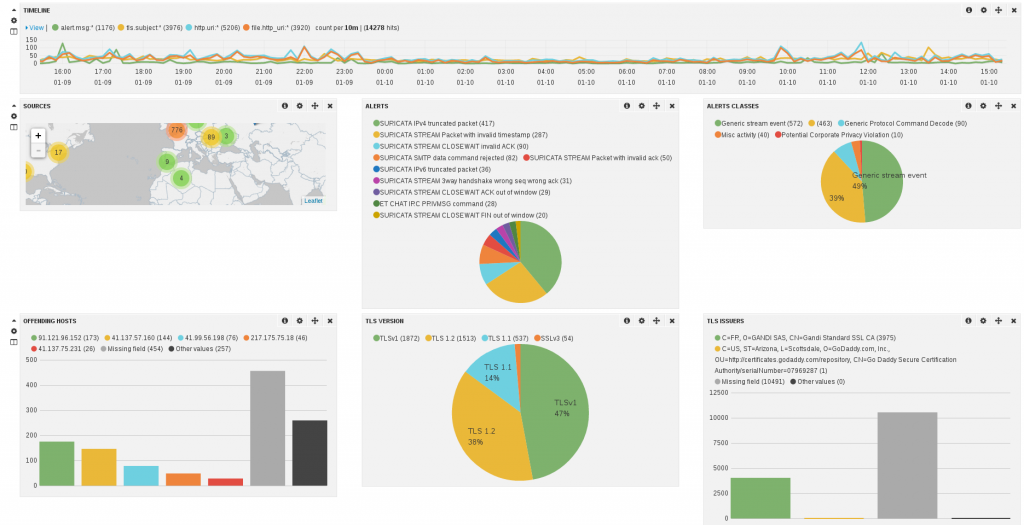
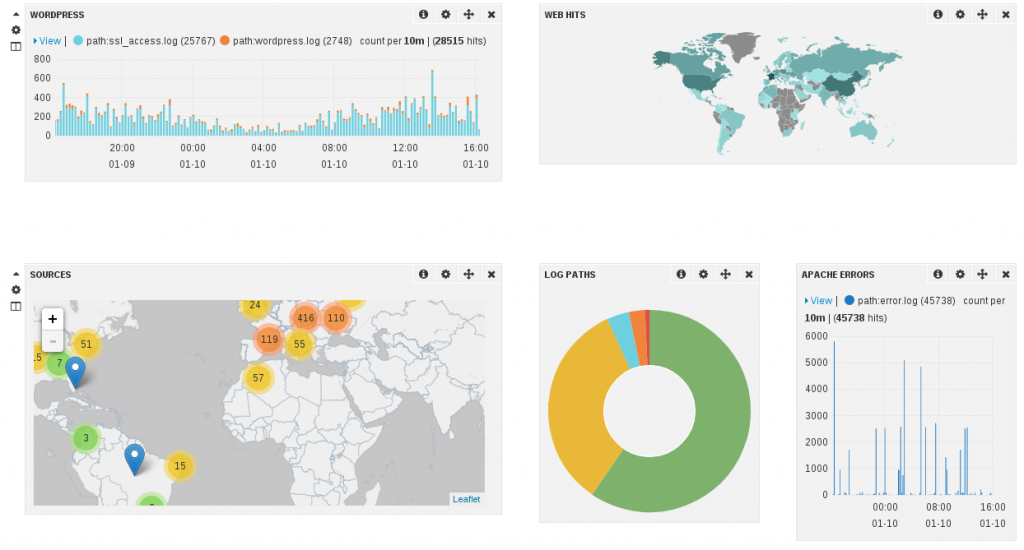
I’ve build a set of dashboards. The screenshot below shows a part of the one being dedicated to suricata:

Setup
My data sources were the following:
- System logs
- Apache logs
- Suricata full JSON logs (should be available in suricata 2.0)
System logs
The setup was mostly really easy. I’ve just added a grok pattern to detect successful and unsuccessful connections on the ssh server.
input {
  file {
    type => "linux-syslog"
    path => [ "/var/log/daemon.log", "/var/log/auth.log", "/var/log/mail.info" ]
  }
filter {
  if [type] == "linux-syslog" {
      grok {
        match => { "message" => "Accepted %{WORD:auth_method} for %{USER:username} from %{IP:src_ip} port %{INT:src_port} ssh2" }
      }
      grok {
        match => { "message" => "Invalid user %{USER:username} from %{IP:src_ip}" }
      }
  }
}
Apache logs
For apache, it was even easier for access.log:
  file {
    path => [ "/var/log/apache2/*access.log" ]
    type => "apache-access"
  }

  file {
    type => "apache-error"
    path => "/var/log/apache2/error.log"
  }
}
filter {
  if [type] == "apache-access" {
      grok {
        match => { "message" => "%{COMBINEDAPACHELOG}" }
      }
  }

  if [type] == "apache-error" {
      grok {
        match => { "message" => "%{APACHEERRORLOG}" }
        patterns_dir => ["/var/lib/logstash/etc/grok"]
      }
  }
}
For error log, I’ve created a grok pattern to get client IP. So I’ve created a file in grok dir with:
HTTPERRORDATE %{DAY} %{MONTH} %{MONTHDAY} %{TIME} %{YEAR}
APACHEERRORLOG \[%{HTTPERRORDATE:timestamp}\] \[%{WORD:severity}\] \[client %{IPORHOST:clientip}\] %{GREEDYDATA:message_remainder}
Netfilter logs
For Netfilter logs, I’ve decided to play it the old way and to parse kernel log instead of using ulogd:
input {
  file {
    type => "kern-log"
    path => "/var/log/kern.log"
  }
}

filter {
 if [type] == "kern-log" {
        grok {
                match => { "message" => "%{IPTABLES}"}
                patterns_dir => ["/var/lib/logstash/etc/grok"]
        }
 }
}
with IPTABLES being defined in a file placed in the grok directory and containing:
 NETFILTERMAC %{COMMONMAC:dst_mac}:%{COMMONMAC:src_mac}:%{ETHTYPE:ethtype}
 ETHTYPE (?:(?:[A-Fa-f0-9]{2}):(?:[A-Fa-f0-9]{2}))
 IPTABLES1 (?:IN=%{WORD:in_device} OUT=(%{WORD:out_device})? MAC=%{NETFILTERMAC} SRC=%{IP:src_ip} DST=%{IP:dst_ip}.*(TTL=%{INT:ttl})?.*PROTO=%{WORD:proto}?.*SPT=%{INT:src_port}?.*DPT=%{INT:dst_port}?.*)
 IPTABLES2 (?:IN=%{WORD:in_device} OUT=(%{WORD:out_device})? MAC=%{NETFILTERMAC} SRC=%{IP:src_ip} DST=%{IP:dst_ip}.*(TTL=%{INT:ttl})?.*PROTO=%{INT:proto}?.*)
 IPTABLES (?:%{IPTABLES1}|%{IPTABLES2})
Exim logs
This part was complicated because exim logs are multiline. So I found a page explaining how to match at least, the logs for delivered mail.
It is using multiline in filter.
Then I added a series of matches to get more information. Each match do only get a part of a message so I’ve used break_on_match not to exit
when one of the match succeed.
input {
  file {
    type => "exim-log"
    path => "/var/log/exim4/mainlog"
  }
}
filter {
  if [type] == "exim-log" {
      multiline {
        pattern => "%{DATE} %{TIME} %{HOSTNAME:msgid} (=>|Completed)"
        what => "previous"
      }
      grok {
        break_on_match => false
        match => [
          "message", "<= %{NOTSPACE:from} H=%{NOTSPACE:server} \[%{IP:src_ip}\]"
        ]
      }
      grok {
        break_on_match => false
        match => [
          "message", "=> %{USERNAME:username} <%{NOTSPACE:dest}> R=%{WORD:transport}"
        ]
      }

      grok {
        break_on_match => false
        match => [
          "message", "=> %{NOTSPACE:dest} R=%{WORD:transport}"
        ]
     }
      grok {
        break_on_match => false
        match => [
          "message", "%{DATE} %{TIME} H=%{NOTSPACE:server}%{GREEDYDATA} \[%{IP:src_ip}\] F=<%{NOTSPACE:mail_to}> temporarily rejected RCPT <%{NOTSPACE:dest}>: greylisted"
        ]
      }
   }
}
Suricata
Suricata full JSON output is JSON so the configuration in logstash is trivial:
input {
   file {
      path => ["/var/log/suricata/eve.json" ]
      codec =>   json
   }
}
You can download a sample Suricata Dashboard to use in in your logstash installation.
The full configuration
Below is the full configuration. There is only one thing which I did not mention. For most source IP, I use geoip to have an idea of the localisation of the IP.
input {
  file {
    type => "linux-syslog"
    path => [ "/var/log/daemon.log", "/var/log/auth.log", "/var/log/mail.info" ]
  }

  file {
    path => [ "/var/log/apache2/*access.log" ]
    type => "apache-access"
  }

  file {
    type => "apache-error"
    path => "/var/log/apache2/error.log"
  }

  file {
    type => "exim-log"
    path => "/var/log/exim4/mainlog"
  }

  file {
    type => "kern-log"
    path => "/var/log/kern.log"
  }

   file {
      path => ["/var/log/suricata/eve.json" ]
      codec =>   json
   }

}

filter {
  if [type] == "apache-access" {
      grok {
        match => { "message" => "%{COMBINEDAPACHELOG}" }
      }
  }
  if [type] == "linux-syslog" {
      grok {
        match => { "message" => "Accepted %{WORD:auth_method} for %{USER:username} from %{IP:src_ip} port %{INT:src_port} ssh2" }
      }
  }

  if [type] == "apache-error" {
      grok {
        match => { "message" => "%{APACHEERRORLOG}" }
        patterns_dir => ["/var/lib/logstash/etc/grok"]
      }
  }

  if [type] == "exim-log" {
      multiline {
        pattern => "%{DATE} %{TIME} %{HOSTNAME:msgid} (=>|Completed)"
        what => "previous"
      }
      grok {
        break_on_match => false
        match => [
          "message", "<= %{NOTSPACE:from} H=%{NOTSPACE:server} \[%{IP:src_ip}\]"
        ]
      }
      grok {
        break_on_match => false
        match => [
          "message", "=> %{USERNAME:username} <%{NOTSPACE:dest}> R=%{WORD:transport}"
        ]
      }

      grok {
        break_on_match => false
        match => [
          "message", "=> %{NOTSPACE:dest} R=%{WORD:transport}"
        ]
     }
      grok {
        break_on_match => false
        match => [
          "message", "%{DATE} %{TIME} H=%{NOTSPACE:server}%{GREEDYDATA} \[%{IP:src_ip}\] F=<%{NOTSPACE:mail_to}> temporarily rejected RCPT <%{NOTSPACE:dest}>: greylisted"
        ]
      }
   }

 if [type] == "kern-log" {
        grok {
                match => { "message" => "%{IPTABLES}"}
                patterns_dir => ["/var/lib/logstash/etc/grok"]
        }
 }

  if [src_ip]  {
    geoip {
      source => "src_ip"
      target => "geoip"
      add_field => [ "[geoip][coordinates]", "%{[geoip][longitude]}" ]
      add_field => [ "[geoip][coordinates]", "%{[geoip][latitude]}"  ]
    }
    mutate {
      convert => [ "[geoip][coordinates]", "float" ]
    }
  }

  if [clientip]  {
    geoip {
      source => "clientip"
      target => "geoip"
      add_field => [ "[geoip][coordinates]", "%{[geoip][longitude]}" ]
      add_field => [ "[geoip][coordinates]", "%{[geoip][latitude]}"  ]
    }
    mutate {
      convert => [ "[geoip][coordinates]", "float" ]
    }
  }

  if [srcip]  {
    geoip {
      source => "srcip"
      target => "geoip"
      add_field => [ "[geoip][coordinates]", "%{[geoip][longitude]}" ]
      add_field => [ "[geoip][coordinates]", "%{[geoip][latitude]}"  ]
    }
    mutate {
      convert => [ "[geoip][coordinates]", "float" ]
    }
  }
}

output {
  stdout { codec => rubydebug }
  elasticsearch { embedded => true }
}


Thanks for the great share!
I was trying the exim config part but I keep on getting something like:
{

       "message" => "2014-02-20 14:07:25 [28824] SMTP connection from (00a5e309.spiner33.eu) [1.2.3.4]:34701 I=[5.6.7.8]:25 closed by QUIT",

      "@version" => "1",

    "@timestamp" => "2014-02-21T02:47:28.182Z",

          "host" => "host.domain.com",

          "path" => "/var/log/exim_mainlog",

          "tags" => [

        [0] "_grokparsefailure"

    ]

}
Any idea what part I’m doing it wrong?
It seems a consecutive grok on the filter won’t work also.
Hello Bryan,
There is currently no grok pattern in the configuration I’ve proposed for this log event. You need to add one if you want to extract the info.
Oh right! Thanks Eric.
I managed to filter and parse a few lines but couldn’t get to work the multiline part.
Guess I need to create a strong pattern on the multiline.
A working exim configuration would be nice but sadly it cannot be done and the example showed here is flawed.
The problem is that the lines of different emails are mixed together randomly in the exim logs, so that you cannot simply join all the consecutive lines until “Completed” because in many cases you will group together the wrong lines from different emails.
Hi Massimiliano,
Good point. I did not see this on my low traffic mail. I will try to see if a fix is possible.
I’d be interested in a solution for Exim logs too. Isn’t there a way to get multiline to match all previous lines with the same message ID?
Hello,
thanks for nice post. but this config is for a logs on the same server, right?
Would be nice to have exim logs parsed, since thats how I found this post 🙂
Thanks
I’ve spent some time working on the “Exim problem” and have come up with a solution – it might not work for you, but it does for me. It’s a bit more extensive than the short config you have above 🙂
http://graemef.wordpress.com/tech-stuff/exim-logstash/
I am working on a solution to display Client OS count in the panel. This information is based on the tomcat access logs. Is it possible to get client OS only without the browser information?
Thanks for the help,
Ramana
Thanks for the information. I am trying to understand syslog section.
grok {
match => { “message” => “Accepted %{WORD:auth_method} for %{USER:username} from %{IP:src_ip} port %{INT:src_port} ssh2” }
}
grok {
match => { “message” => “Invalid user %{USER:username} from %{IP:src_ip}” }
}
Does this mean that each line of log file has to pass two grok above?
Very nice and detailed article!
very useful. Thank you!
How do we do a match for all firewalls .
Not sure how to use patterns.
Hi
I’m trying logstash with snmptrap, as I have more than 300 switches, but the output for the logs seems to be creepy, how can I get help from utility like grok. Logstash log output.
The following log was generated while creating a loop,.
{
“message” => “#<SNMP::SNMPv2_Trap:0xa35ecc9 @error_index=0, @varbind_list=[#<SNMP::VarBind:0x55c747ad @value=#, @name=[1.3.6.1.2.1.1.3.0]>, #, #<SNMP::VarBind:0x778f8a24 @value=#, @name=[1.3.6.1.2.1.2.2.1.1.9]>, #<SNMP::VarBind:0x5d3f4031 @value=#, @name=[1.3.6.1.2.1.2.2.1.7.9]>, #<SNMP::VarBind:0x625080d6 @value=#, @name=[1.3.6.1.2.1.2.2.1.8.9]>], @error_status=0, @request_id=0, @source_ip=\”1.2.3.4\”>”,
“host” => “1.2.3.4”,
“@version” => “1”,
“@timestamp” => “2015-01-27T10:52:14.133Z”,
“type” => “snmptrap”,
“DISMAN-EXPRESSION-MIB::sysUpTimeInstance” => “01:20:16.00”,
“SNMPv2-MIB::snmpTrapOID.0” => “IF-MIB::linkUp”,
“IF-MIB::ifIndex.9” => “9”,
“IF-MIB::ifAdminStatus.9” => “1”,
“IF-MIB::ifOperStatus.9” => “1”
}
{
“message” => “#<SNMP::SNMPv2_Trap:0x2e515ae2 @error_index=0, @varbind_list=[#<SNMP::VarBind:0x28317376 @value=#, @name=[1.3.6.1.2.1.1.3.0]>, #, #<SNMP::VarBind:0x3336ea98 @value=#, @name=[1.3.6.1.2.1.2.2.1.1.10]>, #<SNMP::VarBind:0x49a5ddd0 @value=#, @name=[1.3.6.1.2.1.2.2.1.7.10]>, #<SNMP::VarBind:0x5ef6efc2 @value=#, @name=[1.3.6.1.2.1.2.2.1.8.10]>], @error_status=0, @request_id=0, @source_ip=\”1.2.3.4\”>”,
“host” => “1.2.3.4”,
“@version” => “1”,
“@timestamp” => “2015-01-27T10:52:14.143Z”,
“type” => “snmptrap”,
“DISMAN-EXPRESSION-MIB::sysUpTimeInstance” => “01:20:16.00”,
“SNMPv2-MIB::snmpTrapOID.0” => “IF-MIB::linkUp”,
“IF-MIB::ifIndex.10” => “10”,
“IF-MIB::ifAdminStatus.10” => “1”,
“IF-MIB::ifOperStatus.10” => “1”
}
{
“message” => “#<SNMP::SNMPv2_Trap:0x2759fcfd @error_index=0, @varbind_list=[#<SNMP::VarBind:0x3fb3985e @value=#, @name=[1.3.6.1.2.1.1.3.0]>, #, #<SNMP::VarBind:0x4ef6abe @value=#, @name=[1.3.6.1.4.1.8886.6.1.50.2.1.4.10]>, #, #<SNMP::VarBind:0x1c35c811 @value=#, @name=[1.3.6.1.4.1.8886.6.1.50.2.1.9.10]>, #<SNMP::VarBind:0xfe121eb @value=#, @name=[1.3.6.1.4.1.8886.6.1.50.2.1.10.10]>], @error_status=0, @request_id=0, @source_ip=\”1.2.3.4\”>”,
“host” => “1.2.3.4”,
“@version” => “1”,
“@timestamp” => “2015-01-27T10:52:14.155Z”,
“type” => “snmptrap”,
“DISMAN-EXPRESSION-MIB::sysUpTimeInstance” => “01:20:16.00”,
“SNMPv2-MIB::snmpTrapOID.0” => “RFC1065-SMI::enterprises.8886.6.1.50.4.1”,
“RFC1065-SMI::enterprises.8886.6.1.50.2.1.4.10” => “1”,
“RFC1065-SMI::enterprises.8886.6.1.50.2.1.8.10” => “\x00\x0E^\x13\xE0V”,
“RFC1065-SMI::enterprises.8886.6.1.50.2.1.9.10” => “9”,
“RFC1065-SMI::enterprises.8886.6.1.50.2.1.10.10” => “1”
}
Rizzy
How to show characters in Visualize, thanks
hi
I installed log-stash on centos 6 but how to get maillog form postfix forwarder machine kindly send me the steps or file to configure or get maillog on logstash server. logstash succesffuly get syslog and messages logs but var/log/maillog not fetch, i installed postfix 2.10 on forwarder machine.
appreciate if some trying to help me
do you have the updated version of each logstash configurations?
Pattern
SPACE \s*
COMMA \,
DETAIL ((([A-Z]-[A-Z]%{SPACE}\)|^$)(\s[-]%{SPACE}))
EXSYSTEM (([A-Z]-[A-Z0-9])|([A-Z0-9]))
Log Details
2016-12-23 00:00:08,429 [X-ABCD ] – EFGH01
Filter
match => [“message”, “%{TIMESTAMP_ISO8601:accessedtime}%{SPACE}([%{DETAIL:details}])%{EXSYSTEM :interfacename}”]
Logstash is successed, But if i see the output from Kibana the accessedtime is not fully qualified
It is showing like accessedtime 2016-12-23 00:00 , The time is not showed properly and interfacename is 0.
accessedtime’s time 18th position data value is moved to interfacename is 0 .
message is 2016-12-23 00:00:08,429 [X-ABCD ] – EFGH01 fine
But it is printed properly before adding EXSYSTEM :interfacename. I don’t know, why it is happening.
Thanks.
Hoi is your all-in-one official airport platform for India’s biggest airports — from flight tracking to food ordering, meet & assist services, duty-free shopping, eSims, and more. Travel smarter, smoother, stress-free.
Thanks I just want to sayCheck the know you are under time pressure or need homework help service immediately. For students, we have therefore introduced a speedy assignment
Great travel services with smooth planning.
Best travel agency for hassle-free trips.
Stress-free travel with perfect itineraries.
Excellent tour management and support team.
Highly recommended travel and tour services.