Some progress on the JSON side
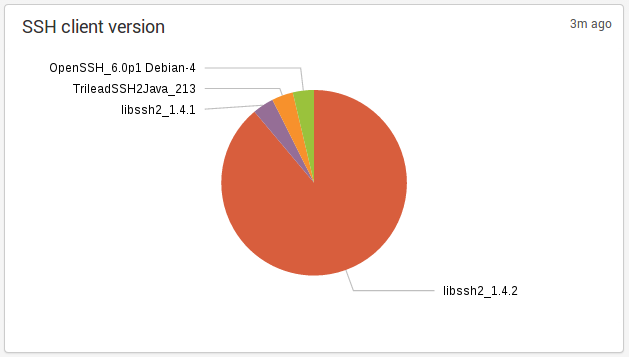
Suricata 2.0-rc2 is out and it brings some progress on the JSON side. The logging of SSH protocol has been added:
and the format of timestamp has been updated to be ISO 8601 compliant and it is now named timestamp instead of time.
Ulogd, the Netfilter logging daemon has seen similar change as it is now also using a ISO 8601 compliant timestamp for the . This feature is available in git and will be part of ulogd 2.0.4.
Thanks to this format change, the integration with logstash or splunk is easier and more accurate.
This permit to fix one problem regarding the timestamp of an event inside of the event and logging manager. At least in logstash, the used date was the one of the parsing which was not really
accurate. It could even be a problem when logstash was parsing a file with old entries because the difference in timestamp could be huge.
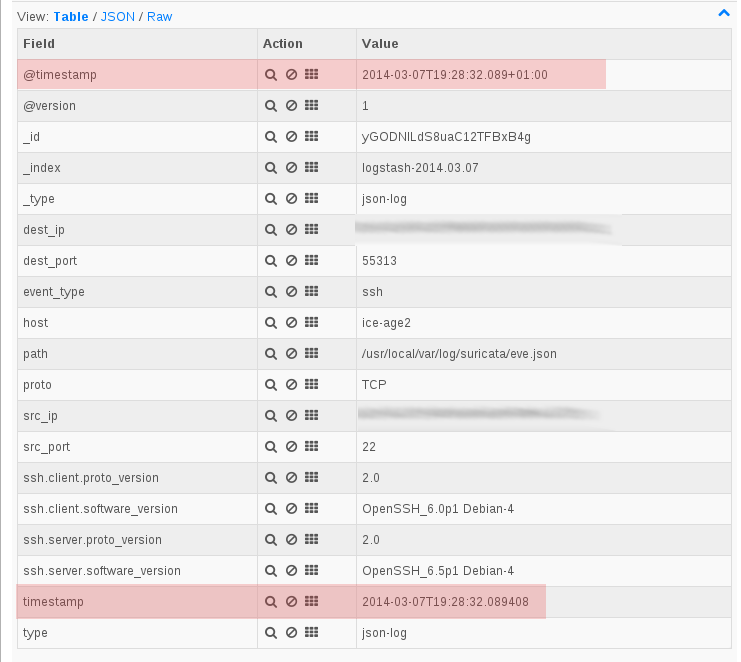
It is now possible to update logstash configuration to have a correct parsing of the timestamp. After doing this the internal @timestamp and the timestamp of the event are synchronized as show on the following screenshot:
Logstash configuration
To configure logstash, you simply needs to tell him that the timestamp field in JSON message is a date. To do so, you need to add a filter:
      date {
        match => [ "timestamp", "ISO8601" ]
      }
A complete logstash.conf would then looks like:
input {
   file {
      path => [ "/usr/local/var/log/suricata/eve.json", "/var/log/ulogd.json" ]
      codec =>   json
      type => "json-log"
   }
}

filter {
   if [type] == "json-log" {
      date {
        match => [ "timestamp", "ISO8601" ]
      }
   }
}

output {
  stdout { codec => rubydebug }
  elasticsearch { embedded => true }
}
Splunk configuration
In splunk, auto detection of the file format is failing and it seems you need to define a type to parse JSON in
$SPLUNK_DIR/etc/system/local/props.conf:
[suricata]
KV_MODE = json
NO_BINARY_CHECK = 1
TRUNCATE = 0
Then you can simply declare the log file in $SPLUNK_DIR/etc/system/local/inputs.conf:
[monitor:///usr/local/var/log/suricata/eve.json]
sourcetype = suricata

[monitor:///var/log/ulogd.json]
sourcetype = suricata
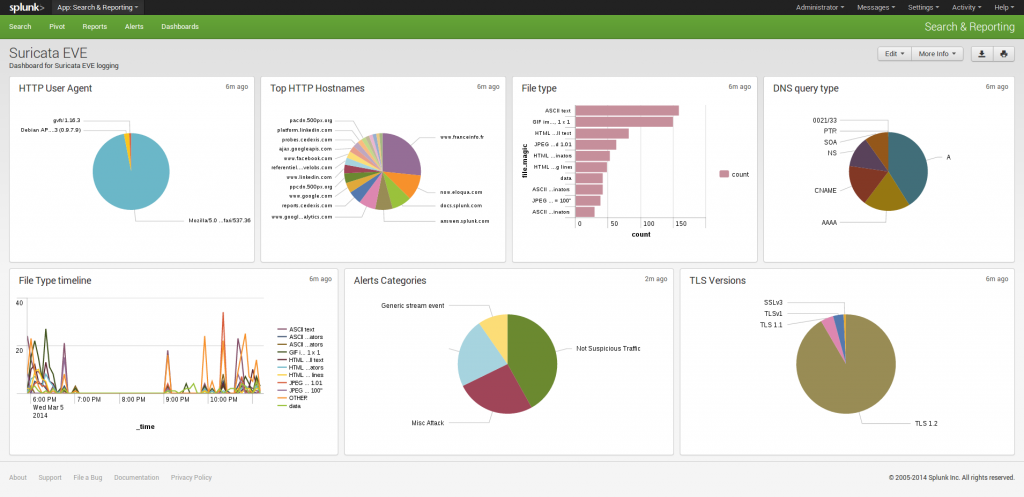
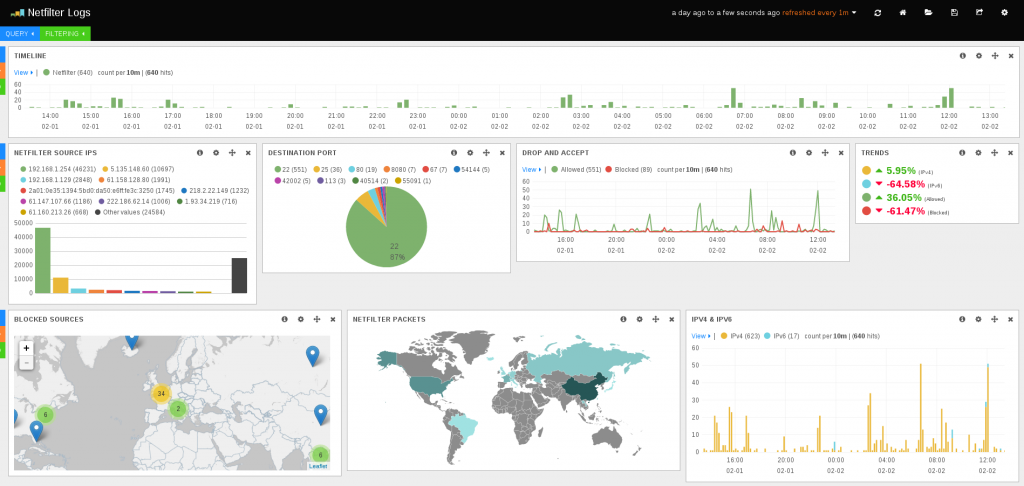
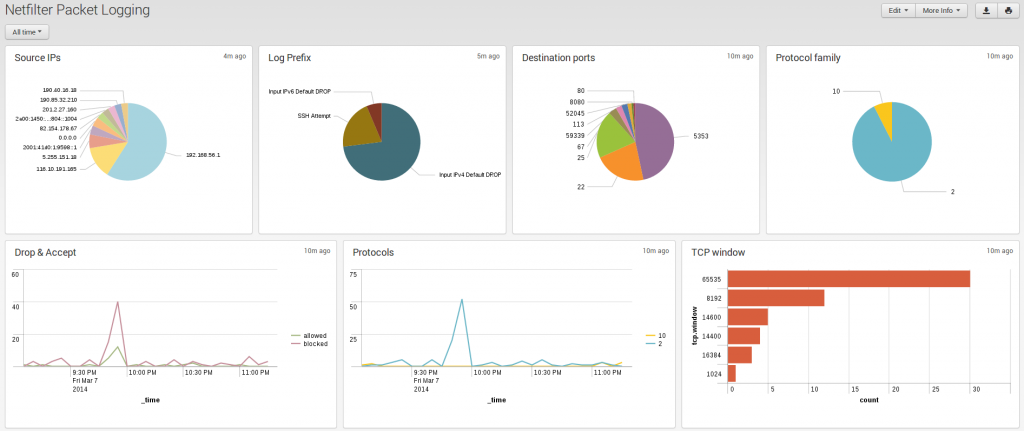
you can now build search events and build dashboard based on Suricata or Netfilter packet logging:
