Introduction
logstash an opensource tool for managing events and logs. It is using elasticsearch for the storage and has a really nice interface named Kibana. One of the easiest to use entry format is JSON.
Suricata is an IDS/IPS which has some interesting logging features. Version 2.0 will feature a JSON export for all logging subsystem. It will then be possible to output in JSON format:
- HTTP log
- DNS log
- TLS log
- File log
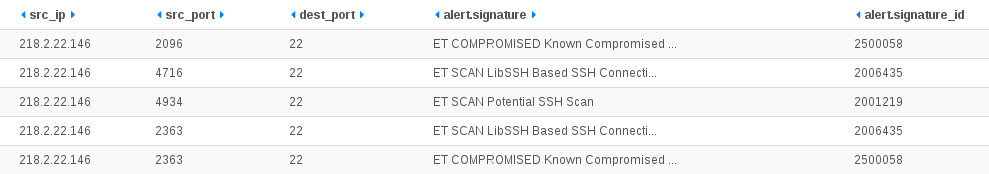
- IDS Alerts
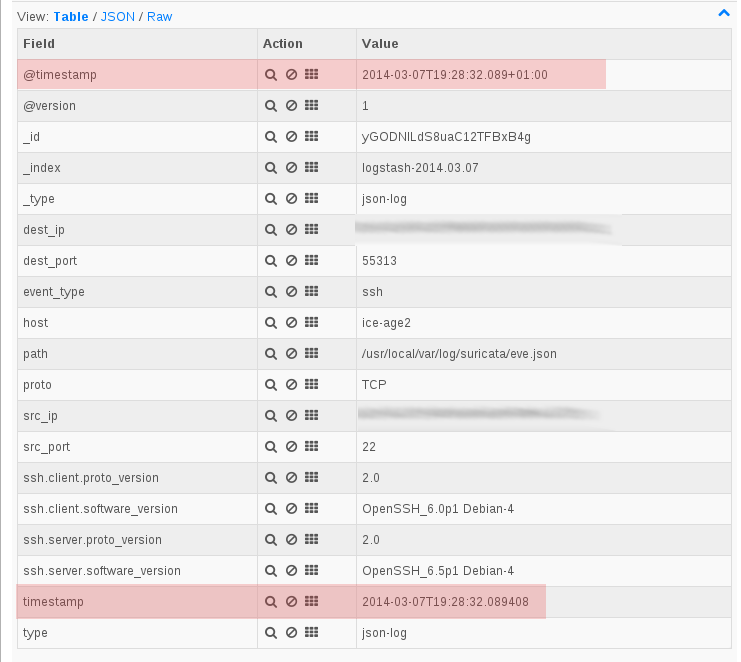
For now, only File log is available in JSON format. This extract meta data from files transferred over HTTP.
Peter Manev has described how to connect Logstash Kibana and Suricata JSON output. Installation is really simple, just download logstash from logstash website, write your configuration file and start the thing.
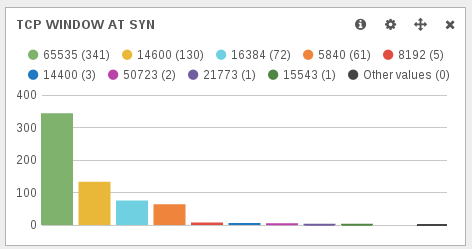
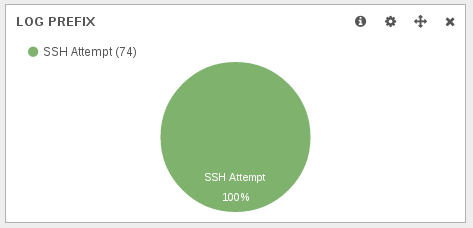
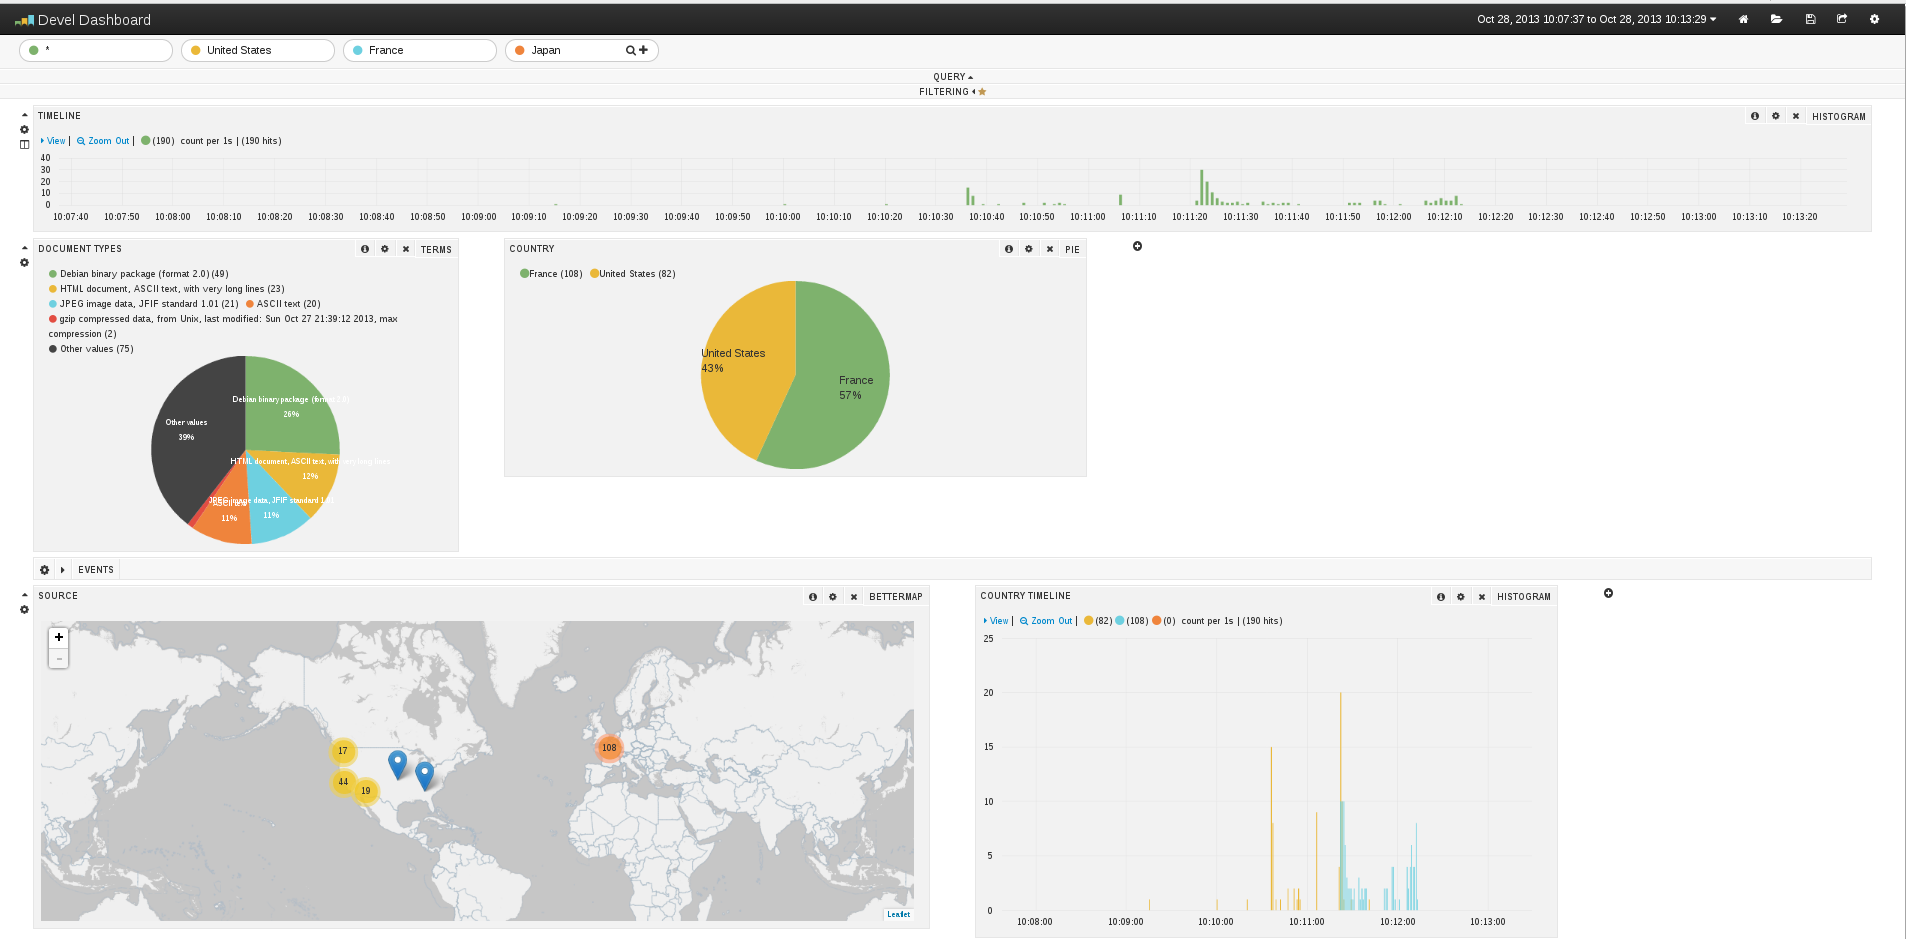
Kibana interface is really impressive:

But at the time, I started to look at the document, a few things were missing:
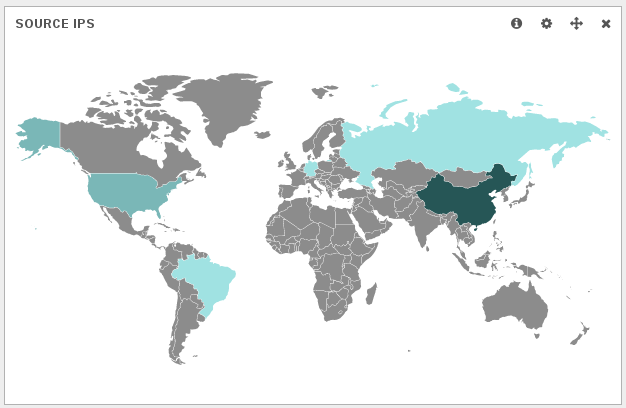
- Geoip is not supported
- All fields containing space appear as multiple entries
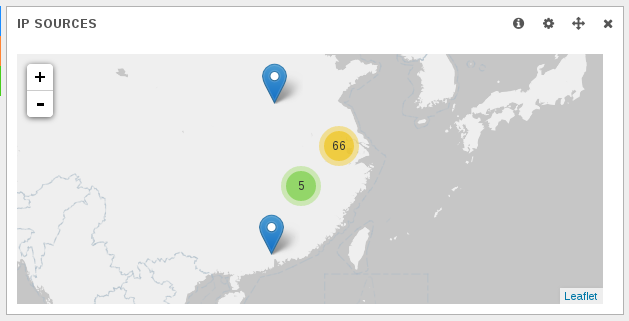
Geoip support
This one was easy. You simply have to edit the logstash.conf file to add a section about geoip:
input {
file {
path => "/home/eric/builds/suricata/var/log/suricata/files-json.log"
codec => json
# This format tells logstash to expect 'logstash' json events from the file.
#format => json_event
}
}
output {
stdout { codec => rubydebug }
elasticsearch { embedded => true }
}
#geoip part
filter {
if [srcip] {
geoip {
source => "srcip"
target => "geoip"
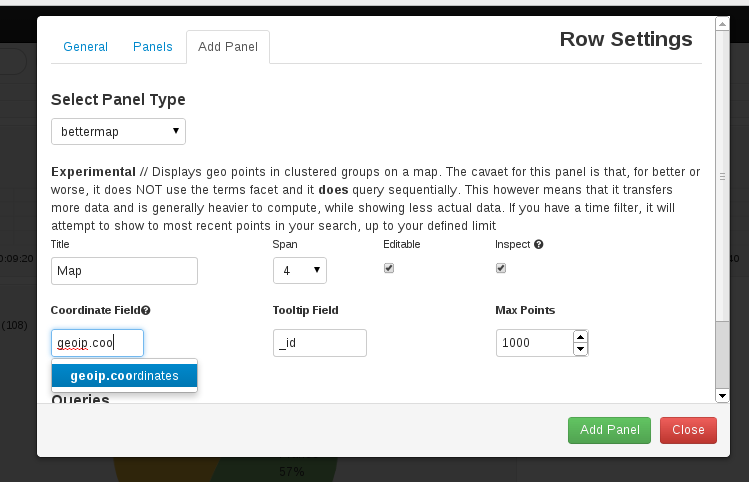
add_field => [ "[geoip][coordinates]", "%{[geoip][longitude]}" ]
add_field => [ "[geoip][coordinates]", "%{[geoip][latitude]}" ]
}
mutate {
convert => [ "[geoip][coordinates]", "float" ]
}
}
}
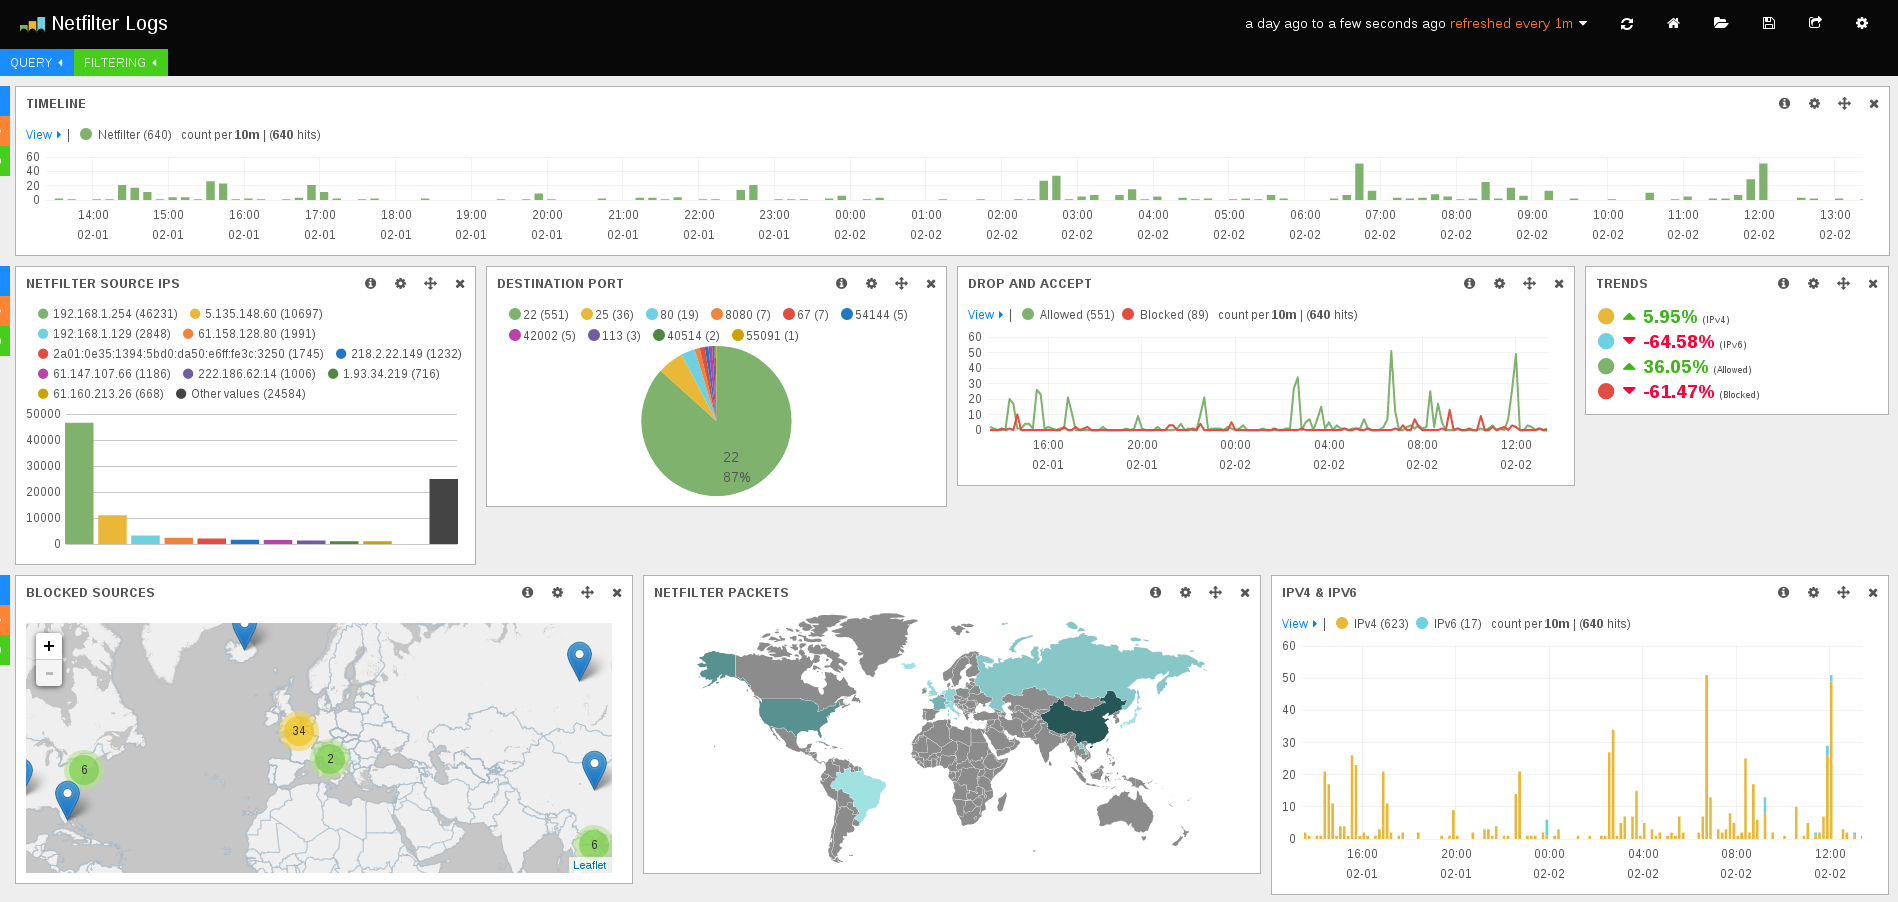
It adds a filter that check for presence of srcip and add geoip information to the entry. The tricky thing is the add_field part that create an array that has to be used when adding a map to kibana dashboard. See following screenshot for explanation:

You may have the following error:
You must specify 'database => ...' in your geoip filter"
In this case, you need to specify the path to the geoip database by adding the database keyword to geoip configuration:
#geoip part
filter {
  if [srcip] {
    geoip {
      source => "srcip"
      target => "geoip"
      database => "/path/to/GeoLiteCity.dat"
      add_field => [ "[geoip][coordinates]", "%{[geoip][longitude]}" ]
      add_field => [ "[geoip][coordinates]", "%{[geoip][latitude]}"  ]
    }
    mutate {
      convert => [ "[geoip][coordinates]", "float" ]
    }
  }
}
Once the file is written, you can start logstash
java -jar /home/eric/builds/logstash/logstash-1.2.2-flatjar.jar agent -f /home/eric/builds/logstash/logstash.conf --log /home/eric/builds/logstash/log/logstash-indexer.out -- web
See Logstash Kibana and Suricata JSON output for detailed information on setup.
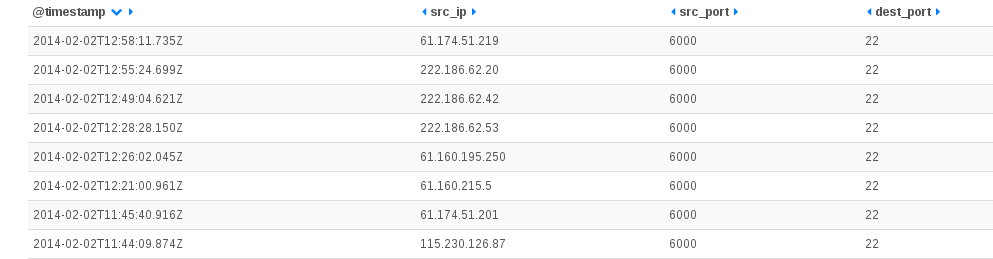
Logstash indexing and mapping
Before logstash 1.3.1, fixing the space issue was really complex. Since that version, all indexed fields are provided with a .raw field that can be used to avoid the problem with spaces in name. So now, you can simply use in Kibana something like geoip.country_name.raw in the definition of graph instead of geoip.country_name. Doing that United States does not appear anymore as United and States.
Fixing the space issue for lostash previous to 1.3.1 was far more complicated for an old guy like me used to configuration files. If finding the origin of the behavior is easy fixing it was more painful. A simple googling shows me that by default elasticsearch storage split string at spaces when indexing. To fix this, you have to specify that the field should not be analyzed during indexing: "index":"not_analyzed"
That was looking easy at first but logstash is not using a configuration file for indexing and mapping. In fact, you need to interact with elasticsearch via HTTP requests. Second problem is that the index are dynamically generated, so there is a template system that you can use to have indexes created the way you want.
Creating an template is easy. You simply do something like:
curl -XPUT http://localhost:9200/_template/logstash_per_index -d '
{
    "template" : "logstash*",
    MAGIC HERE
}'
This will create a template that will be applied to all newly created indexes with name matching “logstash*”. The difficult part is to know what to to put in MAGIC HERE and to check if “logstash*” will match created index. To check this, you can retrieve all current mappings:
curl -XGET 'http://localhost:9200/_all/_mapping'
You then get a list of mappings and you can check the name. But best part is that you can get a base text to update the mapping definition part. With Suricata file log and geoip activated, the following configuration is working well:
curl -XPUT http://localhost:9200/_template/logstash_per_index -d '
{
    "template" : "logstash*",
    "mappings" : {
      "logs" : {
         "properties": {
            "@timestamp":{"type":"date",
            "format":"dateOptionalTime"},
            "@version":{"type":"string"},
            "dp":{"type":"long"},
            "dstip":{"type":"ip"},
            "filename":{"type":"string"},
            "geoip":{
               "properties":{
                  "area_code":{"type":"long"},
                  "city_name":{"type":"string", "index":"not_analyzed"},
                  "continent_code":{"type":"string"},
                  "coordinates":{"type":"string"},
                  "country_code2":{"type":"string"},
                  "country_code3":{"type":"string"},
                  "country_name":{"type":"string", "index":"not_analyzed"},
                  "dma_code":{"type":"long"},
                  "ip":{"type":"string"},
                  "latitude":{"type":"double"},
                  "longitude":{"type":"double"},
                  "postal_code":{"type":"string"},
                  "real_region_name":{"type":"string", "index":"not_analyzed"},
                  "region_name":{"type":"string", "index":"not_analyzed"},
                  "timezone":{"type":"string"}
               }
            },
            "host":{"type":"string"},
            "http_host":{"type":"string"},
            "http_referer":{"type":"string"},
            "http_uri":{"type":"string"},
            "http_user_agent":{"type":"string", "index":"not_analyzed", "omit_norms":true, "index_options":"docs"},
            "ipver":{"type":"long"},
            "magic":{"type":"string", "index":"not_analyzed", "omit_norms":true, "index_options":"docs"},
            "md5":{"type":"string"},
            "path":{"type":"string"},
            "protocol":{"type":"long"},
            "size":{"type":"long"},
            "sp":{"type":"long"},
            "srcip":{"type":"ip"},
            "state":{"type":"string"},
            "stored":{"type":"boolean"},
            "tags":{"type":"string"},
            "timestamp":{"type":"string"}
      }
    }
  }
}'
I’ve added some “index”:”not_analyzed” and improved the type for some of the fields. For example, srcip has been defined as an IP address. This allow to do range searching in Kibana like
["192.168.42.24" TO "192.168.42.45"]
Next point is to update the index format. To to so, you can get the name of current index, delete it and recreate it. To get the name you can use le mapping listing:
curl -XGET 'http://localhost:9200/_all/_mapping'
The return is something like:
{"logstash-2013.10.27":{"logs":{"properties":
So now, we can destroy this index named “logstash-2013.10.27” and have it recreated with the correct
settings:
curl -XDELETE 'http://localhost:9200/logstash-2013.10.27'
curl -XPUT 'http://localhost:9200/logstash-2013.10.27'
We need data to be reindexed so:
curl -XGET 'http://localhost:9200/logstash-2013.10.27/_refresh'
It may also be a good idea to wait for new data as it seems to trigger update in what elasticsearch is sending.


