Using ulogd and JSON output

Ulogd and JSON output

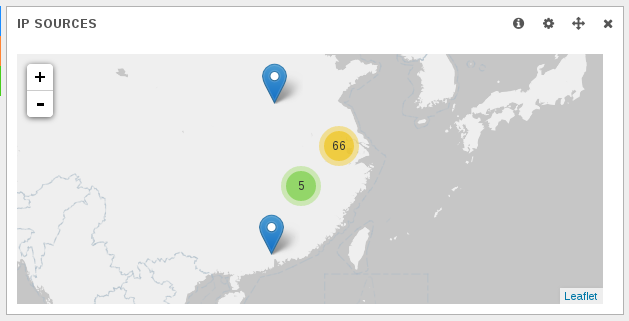
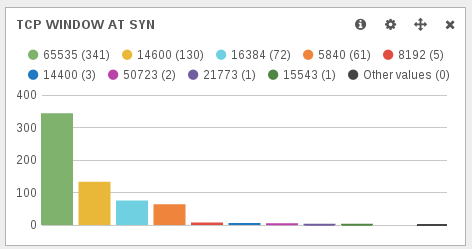
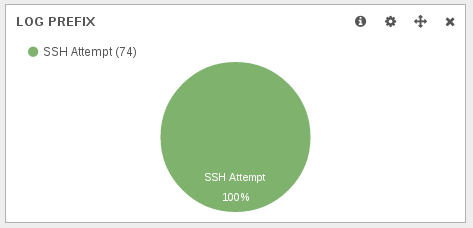
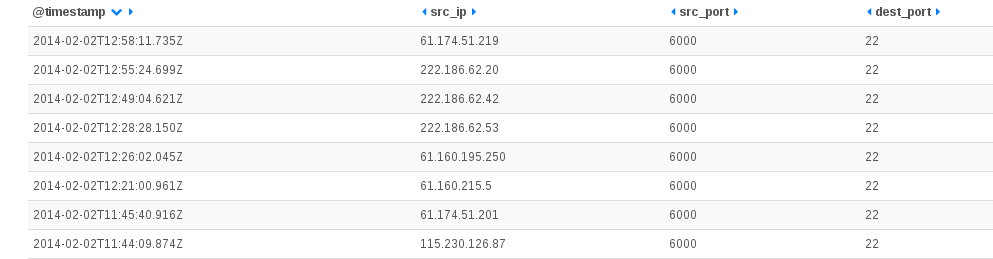
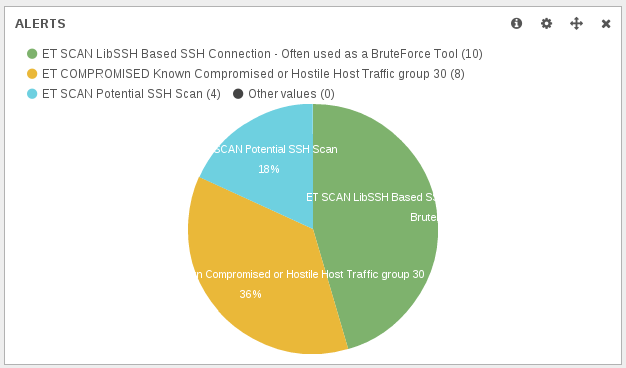
In February 2014, I’ve commited a new output plugin to ulogd, the userspace logging daemon for Netfilter. This is a JSON output plugin which output logs into a file in JSON format. The interest of the JSON format is that it is easily parsed by software just as logstash. And once data are understood by logstash, you can get some nice and useful dashboard in Kibana:

Screenshot from 2014-02-02 13:22:34

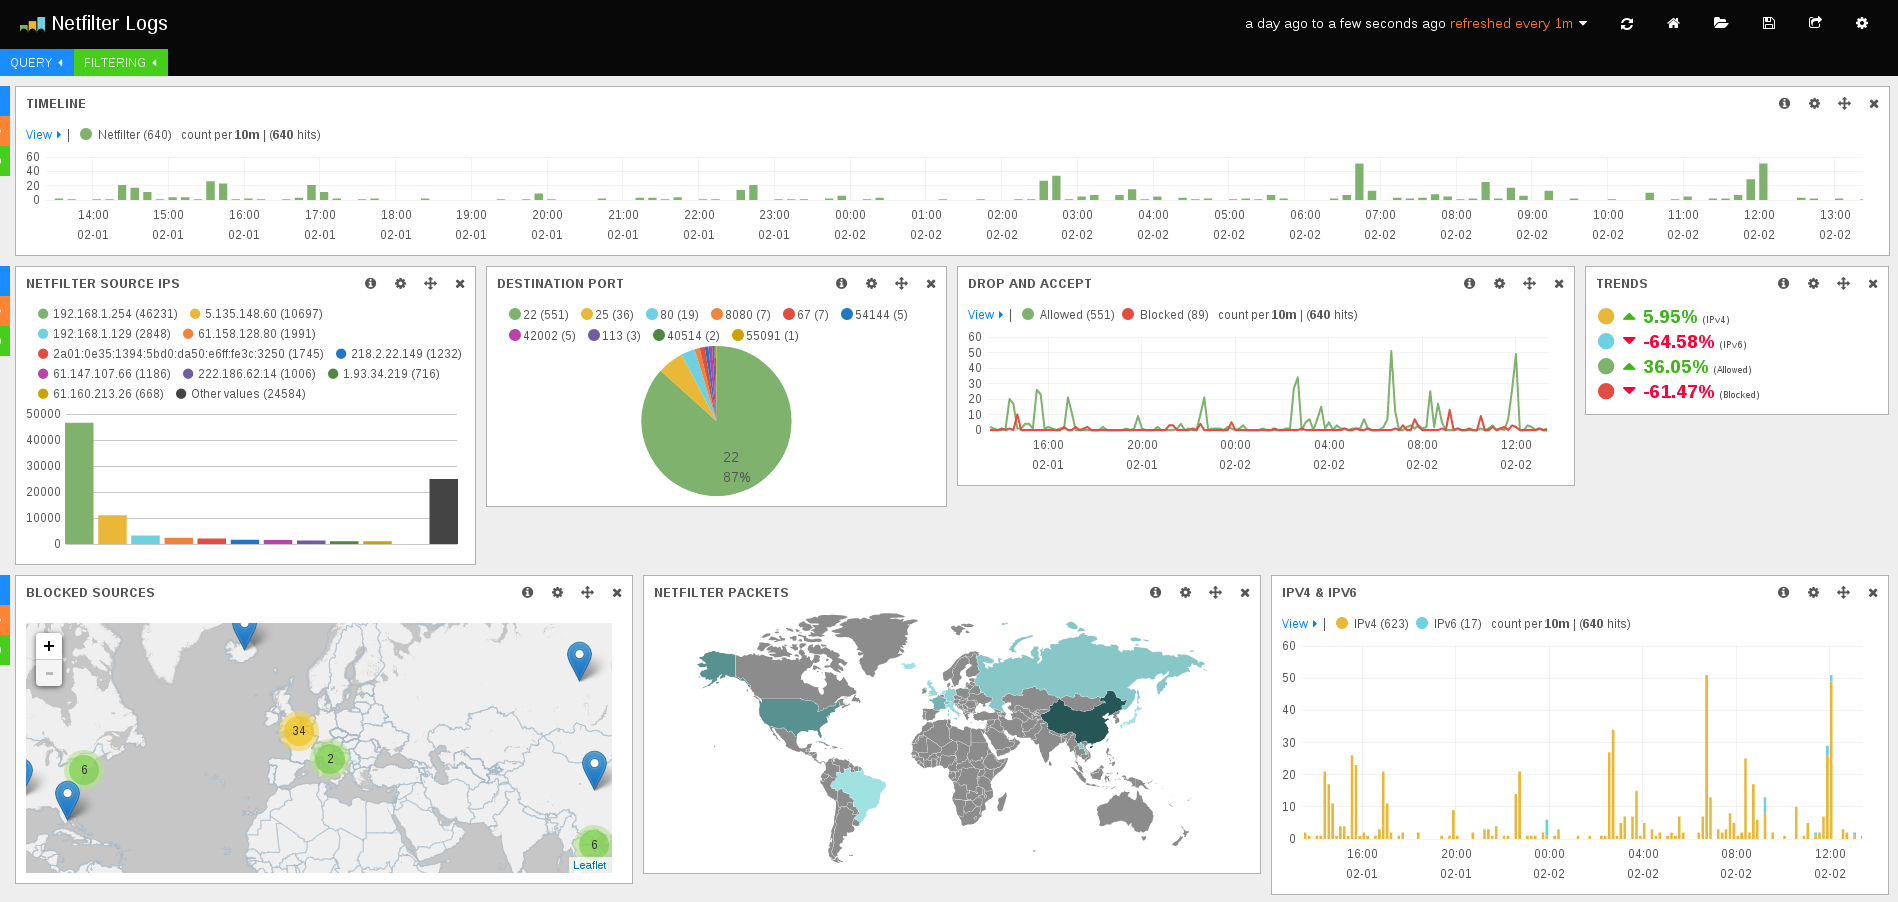
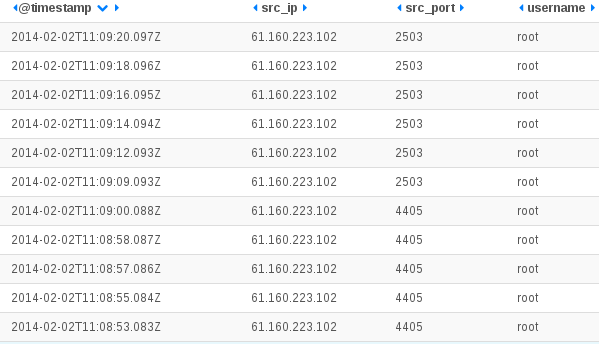
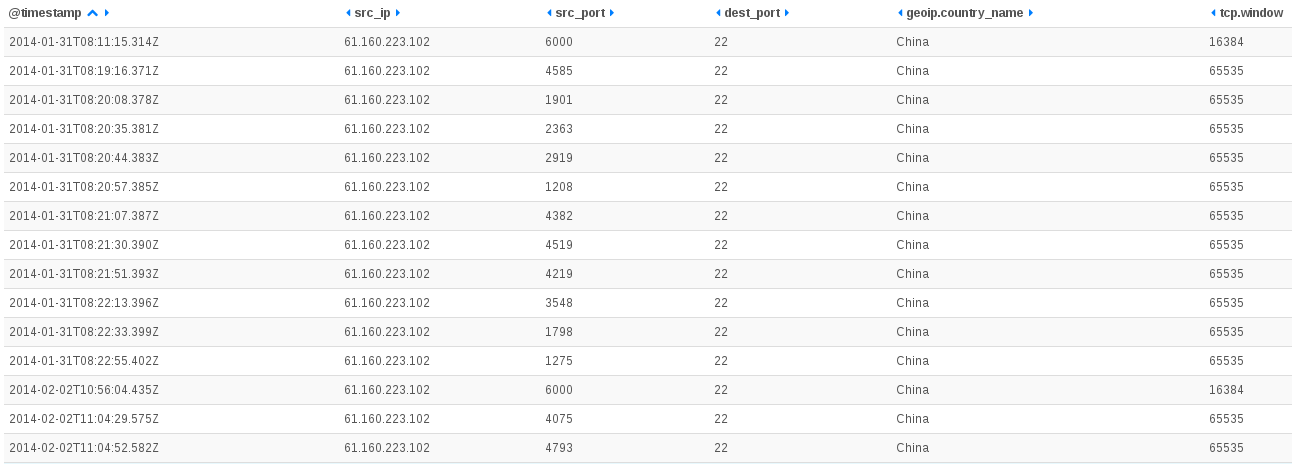
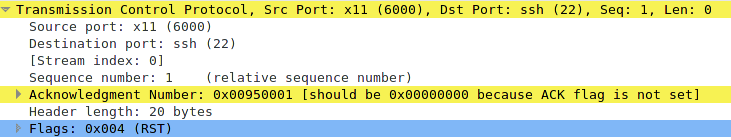
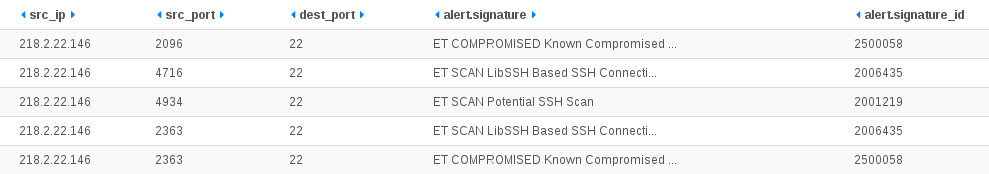
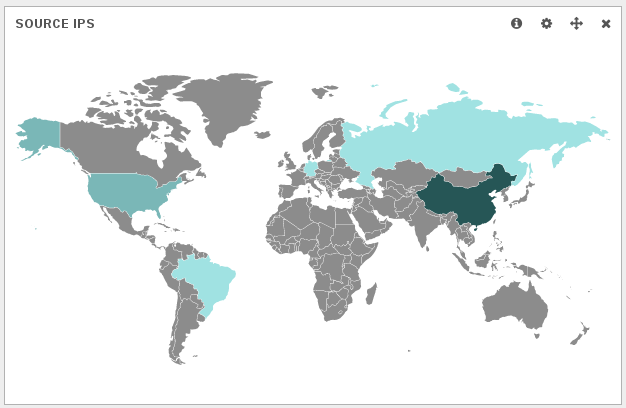
This post explains how to configure ulogd and iptables to do packet logging and differentiate accepted and blocked packets. If you want to see how cool is the result, just check my post: Investigation on an attack tool used in China.

Installation

At the time of this writing, the JSON output plugin for ulogd is only available in the git tree. Ulogd 2.0.4 will contain the feature.

If you need to get the source, you can do:

git clone git://git.netfilter.org/ulogd2

Then the build is standard:

./autogen.sh
./configure
make
sudo make install

Please note that at the end of the configure, you must see:

Ulogd configuration:
  Input plugins:
    NFLOG plugin:			yes
...
    NFACCT plugin:			yes
  Output plugins:
    PCAP plugin:			yes
...
    JSON plugin:			yes

If the JSON plugin is not build, you need to install libjansson devel files on your system and rerun configure.

Configuration

Ulogd configuration

All the edits are made in the ulogd.conf file. With default configure option the file is in /usr/local/etc/.

First, you need to activate the JSON plugin:

plugin="/home/eric/builds/ulogd/lib/ulogd/ulogd_output_JSON.so"

Then we define two stacks for logging. It will be used to differentiate accepted packets from dropped packets:

stack=log2:NFLOG,base1:BASE,ifi1:IFINDEX,ip2str1:IP2STR,mac2str1:HWHDR,json1:JSON
stack=log3:NFLOG,base1:BASE,ifi1:IFINDEX,ip2str1:IP2STR,mac2str1:HWHDR,json1:JSON

The first stack will be used to log accepted packet, so we the numeric_label to 1 in set in [log2].
In [log3], we use a numeric_label of 0.

[log2]
group=1 # Group has to be different from the one use in log1
numeric_label=1

[log3]
group=2 # Group has to be different from the one use in log1/log2
numeric_label=0 # you can label the log info based on the packet verdict

The last thing to edit is the configuration of the JSON instance:

[json1]
sync=1
device="My awesome FW"
boolean_label=1

Here we say we want log and write on disk configuration (via sync) and we named our device My awesome FW.
Last value boolean_label is the most tricky. It this configuration variable is set to 1, the numeric_label will
be used to decide if a packet has been accepted or blocked. It this variable is set non null, then the packet is seen as allowed.
If not, then it is seen as blocked.

Sample Iptables rules

In this example, packets to port 22 are logged and accepted and thus are logged in nflog-group 1. Packet in the default drop rule are sent to group 2 because they are dropped.

iptables -A INPUT -m state --state RELATED,ESTABLISHED -j ACCEPT
iptables -A INPUT ! -i lo -p tcp -m tcp --dport 22 --tcp-flags FIN,SYN,RST,ACK SYN -m state --state NEW -j NFLOG --nflog-prefix  "SSH Attempt" --nflog-group 1
iptables -A INPUT -i lo -j ACCEPT
iptables -A INPUT -p tcp -m tcp --dport 22 -m state --state NEW -j ACCEPT
iptables -A INPUT -j NFLOG --nflog-prefix  "Input IPv4 Default DROP" --nflog-group 2

There is no difference in IPv6, we just use nflog-group 1 and 2 with the same purpose:

ip6tables -A INPUT -m state --state RELATED,ESTABLISHED -j ACCEPT
ip6tables -A INPUT ! -i lo -p tcp -m tcp --dport 22 --tcp-flags FIN,SYN,RST,ACK SYN -m state --state NEW -j NFLOG --nflog-prefix  "SSH Attempt" --nflog-group 1
ip6tables -A INPUT ! -i lo -p ipv6-icmp -m icmp6 --icmpv6-type 128 -m state --state NEW -j NFLOG --nflog-prefix  "Input ICMPv6" --nflog-group 1
ip6tables -A INPUT -p ipv6-icmp -j ACCEPT
ip6tables -A INPUT -p tcp -m tcp --dport 22 -m state --state NEW -j ACCEPT
ip6tables -A INPUT -i lo -j ACCEPT
ip6tables -A INPUT -j NFLOG --nflog-prefix  "Input IPv6 Default DROP" --nflog-group 2

Logstash configuration

Logstash configuration is simple. You must simply declare the ulogd.json file as input and optionaly you can activate geoip on the src_ip key:

input {
   file { 
      path => [ "/var/log/ulogd.json"]
      codec =>   json 
   }
}

filter {
  if [src_ip]  {
    geoip {
      source => "src_ip"
      target => "geoip"
      add_field => [ "[geoip][coordinates]", "%{[geoip][longitude]}" ]
      add_field => [ "[geoip][coordinates]", "%{[geoip][latitude]}"  ]
    }
    mutate {
      convert => [ "[geoip][coordinates]", "float" ]
    }
  }
}

output { 
  stdout { codec => rubydebug }
  elasticsearch { embedded => true }
}

Usage

To start ulogd in daemon mode, simply run:

ulogd -d

You can download logstash from their website and start it with the following command line:

java -jar logstash-1.3.3-flatjar.jar agent -f etc/logstash.conf --log log/logstash-indexer.out -- web

Once done, just point your browser to localhost:9292 and enjoy nice and interesting graphs.

Screenshot from 2014-02-02 13:57:19

Investigation on an attack tool used in China

Log analysis experiment

I’ve been playing lately with logstash using data from the ulogd JSON output plugin and the Suricata full JSON output as well as standard system logs.

Screenshot from 2014-02-02 13:22:34

Ulogd is getting Netfilter firewall logs from Linux kernel and is writing them in JSON format. Suricata is doing the same with alert and other traces. Logstash is getting both log as well as sytem log. This allows to create some dashboard with information coming from multiple sources. If you want to know how to configure ulogd for JSON output check this post. For suricata, you can have a look at this one.

Ulogd output is really new and I was experimenting with it in Kibana. When adding some custom graphs, I’ve observed some strange things and decided to investigate.

Displaying TCP window

TCP window size at the start of the connection is not defined in the RFC. So every OSes have choozen their own default value. It was thus looking interesting to display TCP window to be able to find some strange behavior. With the new ulogd JSON plugin, the window size information is available in the tcp.window key. So, after doing a query on tcp.syn:1 to only get TCP syn packet, I was able to graph the TCP window size of SYN packets.

Screenshot from 2014-02-02 13:22:58

Most of the TCP window sizes are well-known and correspond to standard operating systems:

  • 65535 is or MacOSX or some MS Windows OS.
  • 14600 is used by some Linux.

The first uncommon value is 16384. Graph are clickable on Kibana, so I was at one click of some interesting information.

First information when looking at dashboard after selection TCP syn packet with a window size of 16384 was the fact, it was only ssh scanning:

Screenshot from 2014-02-02 13:58:15

Second information is the fact that, according to geoip, all IPs are chinese:

Screenshot from 2014-02-02 13:57:19

A SSH scanning software

When looking at the details of the attempt made on my IP, there was something interesting:
Screenshot from 2014-02-02 14:04:32

For all hosts, all requests are done with the same source port (6000). This is not possible to do that with a standard ssh client where the source port is by default choosen by the operating system. So or we have a custom standard software that perform a bind operation to port 6000 at socket creation. This is possible and one advantage would be to be easily authorized through a firewall if the country had one. Or we could have a software developped with low level (RAW) sockets for performance reason. This would allow a faster scanning of the internet by skipping OS TCP connection handling. There is a lot of posts regarding the usage of port 6000 as source for some scanning but I did not find any really interesting information in them.

On suricata side, most of the source IPs are referenced in ET compromised rules:

Screenshot from 2014-02-02 13:25:03

Analysing my SSH logs, I did not see any trace of ssh bruteforce coming from source port 6000. But when selecting an IP, I’ve got trace of brute force from at least one of the IP:

Screenshot from 2014-02-02 14:31:02

These attackers seems to really love the root account. In fact, I did not manage to find any trace of attempts for user different than root for IP address that are using the port 6000.

Getting back to my ulogd dashboard, I’ve displayed more info about the used scanning sequence:
Screenshot from 2014-02-02 14:34:05

The host scans the box using a scanner using raw socket, then it attacks with a few minutes later with SSH bruteforce tool. The bruteforce tool has a TCP window size at start of 65535. It indicates that a separated software is used for scanning. So we should have an queueing mechanism between the scanner and the bruteforce tool. This may explains the duration between the scan and the bruteforce. Regarding TCP window size value, 65535 seems to indicate a Windows server (which is coherent with TTL value).

Looking at the scanner traffic

Capturing a sample traffic did not give to much information. This is a scanner sending a SYN and cleanly sending a reset when it got the SYN, ACK:

14:27:54.982273 IP (tos 0x0, ttl 103, id 256, offset 0, flags [none], proto TCP (6), length 40)
    218.2.22.118.6000 > 192.168.1.19.22: Flags [S], cksum 0xa525 (correct), seq 9764864, win 16384, length 0
14:27:54.982314 IP (tos 0x0, ttl 64, id 0, offset 0, flags [DF], proto TCP (6), length 44)
    192.168.1.19.22 > 218.2.22.118.6000: Flags [S.], cksum 0xeee2 (correct), seq 2707606274, ack 9764865, win 29200, options [mss 1460], length 0
14:27:55.340992 IP (tos 0x0, ttl 111, id 14032, offset 0, flags [none], proto TCP (6), length 40)
    218.2.22.118.6000 > 192.168.1.19.22: Flags [R], cksum 0xe48c (correct), seq 9764865, win 0, length 0

But it seems the RST packet after the SYN, ACK is not well crafted:
Screenshot from 2014-02-02 16:07:26

More info on SSH bruteforce tool

Knowing the the behavior was scanning from 6000 and starting a normal scanning, I’ve focused the Suricata dashboard on one IP to see if I had some more information:

Screenshot from 2014-02-02 15:21:58

One single IP in the list of the scanning host is triggering multiple alerts. The event table confirmed this:
Screenshot from 2014-02-02 15:16:41

Studying the geographical repartition of the Libssh alert, it appears there is used in other countries than China:
Screenshot from 2014-02-02 15:24:59
So, libssh is not a discriminatory element of the attacks.

Conclusion

A custom attack tool has been been deployed on some Chinese IPs. This is a combination of a SSH scanner based on RAW socket and a SSH bruteforce tool. It tries to gain access to the root account of system via the ssh service. On an organisational level, it is possible there is a Chinese initiative trying to get the low-hanging fruit (system with ssh root account protected by password) or maybe it is just a some organization using some compromised Chinese IPs to try to get control other more boxes.