Some ulogd db improvements

Some new features

I’ve just pushed to ulogd tree a series of patches. They bring two major improvements to database handling:

  • Backlog system: temporary store SQL query in memory if database is down.
  • Ring buffer system: a special mode with a thread to read data from kernel and a thread to do the SQL query.

The first mode is attended for preventing data loss when database is temporary down. The second one is an attempt to improve performance and the resistance to netlink buffer overrun problem.
The modification has been done in the database abstraction layer and it is thus available in MySQL, PostgreSQL and DBI.

Backlog system

To activate this mode, you need to set the backlog_memcap value in the database definition.

[mysql1]
db="nulog"
...
procedure="INSERT_PACKET_FULL"
backlog_memcap=1000000
backlog_oneshot_requests=10

The backlog system will prevent data loss by storing queries in memory instead of executing them. The waiting queries will be run in order when the connection to the database is restored.

Ring buffer setup

To activate this mode, you need to set ring_buffer_size to a value superior to 1.
The value stores the number of SQL requests to keep in the ring buffer.

[pgsql1]
db="nulog"
...
procedure="INSERT_PACKET_FULL"
ring_buffer_size=1000

The ring_buffer_size has precedence on the backlog_memcap value. And backlog will be disabled if the ring buffer is active.

If the ring buffer mode is active, a thread will be created for each stack involving the configured database. It will connect to the database and execute the queries.
The idea is to try to avoid buffer overrun by minimizing the time requested to treat kernel message. Doing synchronous SQL request, as it was made before was causing a delay which could cause some messages to be lost in case of burst from kernel side.

Conclusion

Feel free to test it and don’t hesitate to provide some feedback!

Netfilter and the NAT of ICMP error messages

The problem

I’ve been recently working for a customer which needed consultancy because of some unexplained Netfilter behaviors related to ICMP error messages. He authorizes me to share the result of my study and I thank him for making this blog entry possible.
His problem was that one of his firewalls is using a private interconnexion with their border router and the customer did not manage to NAT all outgoing ICMP error messages.

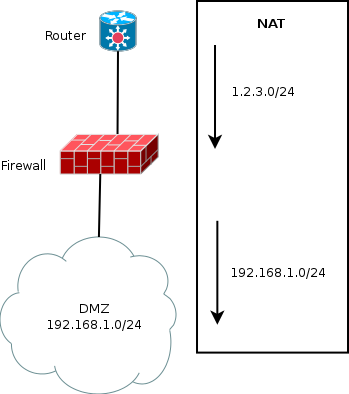
The simplified network diagram is the following:

The DMZ is in a private network. The router has a route to the public network via the firewall and the public network address do not exists.
The firewall has set of DNAT rules to redirect a public IP to the matching private IP:

iptables -A PREROUTING -t nat -d 1.2.3.X -j DNAT --to 192.168.1.X

The interconnection between the router and firewall is made using a private network. Let’s say 192.168.42.0/24 and 192.168.42.1 for the firewall. The interface eth0 is the one used as interconnection interface.

On the firewall, some filtering rules reject some FORWARD traffic:

iptables -A FORWARD -d 192.168.1.X -j REJECT
iptables -A FORWARD -d 192.168.1.Y -j REJECT

The issue is related with the ICMP unreachable messages. When someone from internet (behind the router) is sending a packet to 192.168.1.X or 192.168.1.Y then:

  • If 192.168.1.X is NATed then the ICMP unreachable message is emitted and seen as coming from 1.2.3.X on eth0.
  • If 192.168.1.Y is not NATed then the ICMP unreachable message is emitted and seen as coming from 192.168.42.1 on eth0.

So, a packet going to 192.168.1.Y results in a ICMP message which is not routed by the router due to the private IP.

To fix the issue, the customer has added a Source NAT rules to translate all packet coming from 192.168.42.1 to 1.2.3.1:

iptables -A POSTROUTING -t nat -p icmp -s 192.168.42.1 -o eth0 -j SNAT --to 1.2.3.1

But this rules has no effect on the ICMP unreachable message.

Explanations

In the case of packets going to X or Y, an ICMP message is sent. Internally the same function (called icmp_send) is used for to send the icmp error message. This is a standard function and
as such, it uses the best local source address possible. In our case the best address is 192.168.42.1 because the packet has to get back through eth0.
At current stage, there is no difference between the two ICMP packets and the result should be the same.

But if nothing is done, the packet to X will result in a packet going to the original source and containing the internal IP information: the packet has been NATed so we have 192.168.1.X and not the public IP in the original packet data contained in the ICMP message. This is a real problem as this will leak private information to the outside.

Hopefully, the packets are handled differently due to the ICMP error connection tracking module. It searches in the payload part of the ICMP error message if it belongs to existing connection. If a connection is found, the IMCP packet is marked as RELATED to the original connection. Once this is done, the ICMP nat helper makes the reverse transformation to send to the network a packet containing only public information. For packet to X, the source addresses of the ICMP messages and payload are modified to the public IP address. This explains the difference between the ICMP error message sent because of packet sent to X or sent to Y.

But this does not explain why the NAT rules inserted by the customer did not work. In fact, the response was already made: the ICMP packet is marked as belonging to a connection related to the original one. Being in a RELATED state, it will not cross the NAT in POSTROUTING as only packet with a connection in state NEW are sent to the nat tables.

The validation of this study can be done by using marking and logging. If we log a packet which belong to a RELATED connection and if we are sure that the original connection is the one we are tracing then our hypothesis is validated. Getting a RELATED connection is easy with the filter: “-m conntrack –ctstate RELATED”. To prove that the packet is RELATED to the original connection, we have to use the fact that RELATED connection inherit of the connection mark of the originating connection. Thus, if we set a connection mark with the CONNMARK target, we will be able to match it in the ICMP error message. The following rules implement this:

iptables -t mangle -A PREROUTING -d 1.2.3.4 -j CONNMARK --set-mark 1
iptables -A OUTPUT -t mangle -m state --state RELATED -m connmark --mark  1 -j LOG

And it logs an ICMP error message when we try to reach 1.2.3.4.

Other debug methods

Using conntrack

The conntrack utils can be used to display connection tracking events by using the -E flag:

# conntrack -E
    [NEW] tcp      6 120 SYN_SENT src=192.168.1.12 dst=91.121.96.152 sport=53398 dport=22 [UNREPLIED] src=91.121.96.152 dst=192.168.1.12 sport=22 dport=53398
 [UPDATE] tcp      6 60 SYN_RECV src=192.168.1.12 dst=91.121.96.152 sport=53398 dport=22 src=91.121.96.152 dst=192.168.1.12 sport=22 dport=53398
 [UPDATE] tcp      6 432000 ESTABLISHED src=192.168.1.12 dst=91.121.96.152 sport=53398 dport=22 src=91.121.96.152 dst=192.168.1.12 sport=22 dport=53398 [ASSURED]

This can be really useful to see what transformation are made by the connection tracking system. But this does not work in your case because the icmp message does not trigger any connection creation and so no event.

Using TRACE target

The TRACE target is a really useful tool. It allows you to see which rules are matched by a packet. It’s usage is really simple. For example, if we want to trace all ICMP traffic coming to the box:

iptables -A PREROUTING -t raw  -p icmp -j TRACE

In our test system, the result was the following:

[ 5281.733217] TRACE: raw:PREROUTING:policy:2 IN=eth0 OUT= MAC=08:00:27:a9:f5:30:0a:00:27:00:00:00:08:00 SRC=192.168.56.1 DST=1.2.3.4 LEN=84 TOS=0x00 PREC=0x00 TTL=64 ID=0 DF PROTO=ICMP TYPE=8 CODE=0 ID=12114 SEQ=1
[ 5281.737057] TRACE: nat:PREROUTING:rule:1 IN=eth0 OUT= MAC=08:00:27:a9:f5:30:0a:00:27:00:00:00:08:00 SRC=192.168.56.1 DST=1.2.3.4 LEN=84 TOS=0x00 PREC=0x00 TTL=64 ID=0 DF PROTO=ICMP TYPE=8 CODE=0 ID=12114 SEQ=1
[ 5281.737057] TRACE: nat:PREROUTING:rule:2 IN=eth0 OUT= MAC=08:00:27:a9:f5:30:0a:00:27:00:00:00:08:00 SRC=192.168.56.1 DST=1.2.3.4 LEN=84 TOS=0x00 PREC=0x00 TTL=64 ID=0 DF PROTO=ICMP TYPE=8 CODE=0 ID=12114 SEQ=1
[ 5281.737057] TRACE: filter:FORWARD:rule:1 IN=eth0 OUT=eth1 MAC=08:00:27:a9:f5:30:0a:00:27:00:00:00:08:00 SRC=192.168.56.1 DST=192.168.42.4 LEN=84 TOS=0x00 PREC=0x00 TTL=63 ID=0 DF PROTO=ICMP TYPE=8 CODE=0 ID=12114 SEQ=1

In the raw TABLE, in PREROUTING the policy is applied (here ACCEPT). In nat PREROUTING the first rule is matching (a mark rule) and the second one is matching too. Finally in FORWARD, the first rule is matching (here the REJECT rule). TRACE is only following the initial packet and thus does not display any information about the ICMP error message.

Conclusion

So Netfilter’s behavior is correct when it translate back the elements initially transformed by NAT. The surprising part comes from the fact that the NAT rules in POSTROUTING are not reach. But this is needed to avoid any complicated issue by doing multiple transformation. Regarding interconnexion with router, you should really use a public network if you want your ICMP error messages to be seen on Internet.

The defense blues

Mother Nature has been really unfair with me. It has given me two strong interests in life: building things and information security. Once that was done, my doom was sealed and I’ve become a infosec defense guy. Nowadays this is one of the worst fate possible in computer science.

Today, this burden is really hard to wear. I know some of you will try to encourage me by saying this like:

It is not that bad. You could have been a Microsoft Exchange administrator.

And they are right. I’m doing really interesting things and taking a lot of pleasure at doing them. The point is not here. It is on the way information security community is evolving. It is cheering the offensive guys and as everybody want to be loved this lead to absurd and dangerous behaviors. And this is just becoming worse every day.

My last example is a conference given at Blackhat by Antonios Atlasis, Chief/Research at Center for strategic cyberspace + security science. The talk is advertised on CSCSS website which is a first sign of the importance of infosec circus for this kind of entity. But let’s get back to the main issue. The talk is showing some results of a study made by Mr. Atlasis on security impact of IPv6 extension headers. Among the result, successful evasion of two well-known IDS: snort and Suricata. And this completely pissed me off.

I’m one of the developer of Suricata and we never have been contacted by the guy before the event. So to sum up, a guy working for a not-for-profit organization is publishing attacks on software without even having warn the editor before. That’s just insane. And this show, the current spirit in information security:

I publish vulnerability without warning editor to maximize the impact of my talk

The worse thing is that I know that a possible defense will be:

I’m a good guy cause I could have sell it as a O-day

That’s not a real excuse. O-day sellers are just blackhats in suit. Or to be more accurate as I know some of them don’t wear suit, blackhats doing public business thanks to the legal void on the selling of cyberweapons. A guy working for a not-for-profit organization has to be a whitehat. I think this is even mandatory in the USA as it seems the not-for-profit organization must act for public good.

Yes, being a defensive guy is not fair. You build huge and complex structure and all the light (and sometime the money) is for the one who demonstrate how one of the thousand engines you’ve build can be abused. And this is the climax when the guy disrespects you by not letting you a chance to fix the issue before it goes public.

Suricata, to 10Gbps and beyond

Introduction

Since the beginning of July 2012, OISF team is able to access to a server where one interface is receiving
some mirrored real European traffic. When reading "some", think between 5Gbps and 9.5Gbps
constant traffic. With that traffic, this is around 1Mpps to 1.5M packet per seconds we have to study.

The box itself is a standard server with the following characteristics:

  • CPU: One Intel(R) Xeon(R) CPU E5-2680 0 @ 2.70GHz (16 cores counting Hyperthreading)
  • Memory: 32Go
  • capture NIC: Intel 82599EB 10-Gigabit SFI/SFP+

The objective is simple: be able to run Suricata on this box and treat the whole
traffic with a decent number of rules. With the constraint not to use any non
official system code (plain system and kernel if we omit a driver).

The code on the box have been updated October 4th:

  • It runs Suricata 1.4beta2
  • with 6719 signatures
  • and 0% packet loss
  • with setup described below

The setup is explained by the following schema:
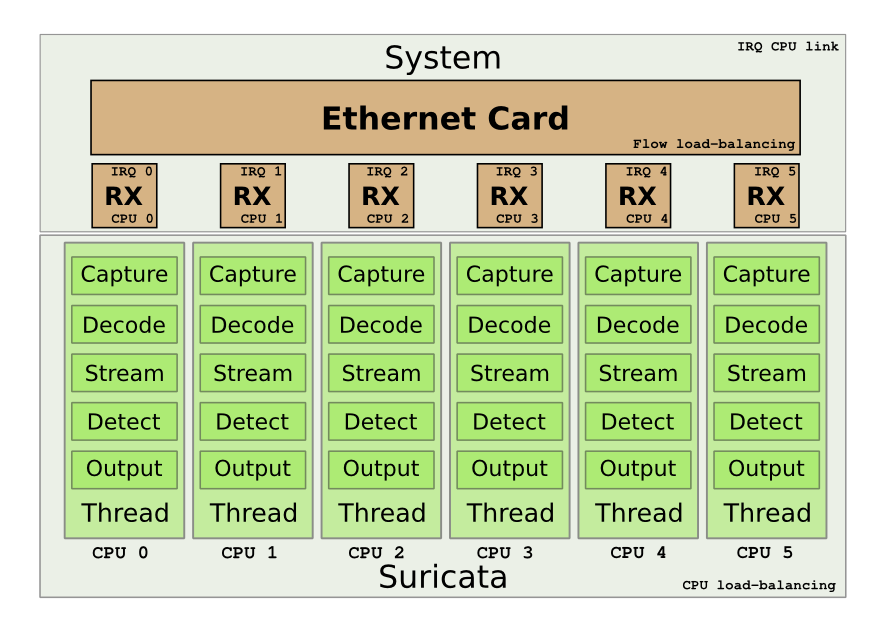
We want to use the multiqueue system on the Intel card to be able to load balance the treatment. Next goal is to have one single CPU to treat the packet from the start to the end.

Peter Manev, Matt Jonkmann, Anoop Saldanha and Eric Leblond (myself) have been involved in
the here described setup.

Detailed method

The Intel NIC benefits from a multiqueue system. The RX/TX traffic can be load-balanced
on different interrupts. In our case, this permit to handle a part of the flow on each
CPU. One really interesting thing is that the load-balancing can be done with respect
to the IP flows. By default, one RX queue is created per-CPU.

More information about multiqueue ethernet devices can be found in the document
networking/scaling.txt in the Documentation directory of Linux sources.

Suricata is able to do zero-copy in AF_PACKET capture mode. One other interesting feature
of this mode is that you can have multiple threads listening to the same interface. In
our case, we can start one threads per queue to have a load-balancing of capture on all
our resources.

Suricata has different running modes which define how the different parts of the engine
(decoding, streaming, siganture, output) are chained. One of the mode is the ‘workers’
mode where all the treatment for a packet is made on a single thread. This mode is
adapted to our setup as it will permit to keep the work from start to end on a single
thread. By using the CPU affinity system available in Suricata, we can assign each
thread to a single CPU. By doing this the treatment of each packet can be done on
a single CPU.

But this does not solve one problem which is the link between the CPU receiving the packet
and the one used in Suricata.
To do so we have to ensure that when a packet is received on a queue, the CPU that will
handle the packet will be the same as the one treating the packet in Suricata. David
Miller had already planned this kind of setup when coding the fanout mode of AF_PACKET.
One of the flow load balancing mode is flow_cpu. In this mode, the packet is delivered to
the same track depending on the CPU.

The dispatch is made by using the formula "cpu % num" where cpu is the cpu number and
num is the number of socket bound to the same fanout socket. By the way, this imply
you can’t have a number of sockets superior to the number of CPUs.
A code study shows that the assignement in the array of sockets is incrementally made.
Thus first socket to bind will be assigned to the first CPU, etc..
In case, a socket disconnect from the set, the last socket of the array will take the empty place.
This implies the optimizations will be partially lost in case of a disconnect.

By using the flow_cpu dispatch of AF_PACKET and the workers mode of Suricata, we can
manage to keep all work on the same CPU.

Preparing the system

The operating system running on is an Ubuntu 12.04 and the driver igxbe
was outdated.
Using the instruction available on Intel website (README.txt),
we’ve updated the driver.
Next step was to unload the old driver and load the new one

sudo rmmod ixgbe
sudo modprobe ixgbe FdirPballoc=3

Doing this we’ve also tried to use the RSS variable. But it seems there is an issue, as we still having 16 queues although the RSS params was
set to 8.

Once done, the next thing is to setup the IRQ handling to have each CPU linked in order with
the corresponding RX queue. irqbalance was running on the system and the setup was
correctly made.

The interface was using IRQ 101 to 116 and /proc/interrupts show a diagonale indicating
that each CPU was assigned to one interrupt.

If not, it was possible to use the instruction contained in IRQ-affinity.txt available
in the Documentation directory of Linux sources.

But the easy way to do it is to use the script provided with the driver:

ixgbe-3.10.16/scripts$ ./set_irq_affinity.sh eth3

Note: Intel latest driver was responsible of a decrease of CPU usage. With Ubuntu kernel version, the CPU usage as 80% and it is 45% with latest Intel driver.

The card used on the system was not load-balancing UDP flow using port. We had to use
‘ethtool’ to fix this

regit@suricata:~$ sudo ethtool -n eth3 rx-flow-hash udp4
UDP over IPV4 flows use these fields for computing Hash flow key:
IP SA
IP DA

regit@suricata:~$ sudo ethtool -N eth3 rx-flow-hash udp4 sdfn
regit@suricata:~$ sudo ethtool -n eth3 rx-flow-hash udp4
UDP over IPV4 flows use these fields for computing Hash flow key:
IP SA
IP DA
L4 bytes 0 & 1 [TCP/UDP src port]
L4 bytes 2 & 3 [TCP/UDP dst port]

In our case, the default setting of the ring parameters of the card, seems
to indicate it is possible to increase the ring buffer on the card

regit@suricata:~$ ethtool -g eth3
Ring parameters for eth3:
Pre-set maximums:
RX:             4096
RX Mini:        0
RX Jumbo:       0
TX:             4096
Current hardware settings:
RX:             512
RX Mini:        0
RX Jumbo:       0
TX:             512

Our system is now ready and we can start configuring Suricata.

Suricata setup

Global variables

The run mode has been set to ‘workers’

max-pending-packets: 512
runmode: workers

As pointed out by Victor Julien, this is not necessary to increase max-pending-packets too much because only a number of packets equal to the total number of worker threads can be treated simultaneously.

Suricata 1.4beta1 introduce a delayed-detect variable under detect-engine. If set to yes, this trigger a build of signature after the packet capture threads have started working. This is a potential issue if your system is short in CPU as the task of building the detect engine is CPU intensive and can cause some packet loss. That’s why it is recommended to let it to the default value of no.

AF_PACKET

The AF_PACKET configuration is almost straight forward

af-packet:
  - interface: eth3
    threads: 16
    cluster-id: 99
    cluster-type: cluster_cpu
    defrag: yes
    use-mmap: yes
    ring-size: 300000
Affinity

Affinity settings permit to assign thread to set of CPUs. In our case, we onlSet to have in exclusive mode one packet thread dedicated to each CPU. The setting
used to define packet thread property in ‘workers’ mode is ‘detect-cpu-set’

threading:
  set-cpu-affinity: yes
  cpu-affinity:
    - management-cpu-set:
      cpu: [ "all" ]
      mode: "balanced"
      prio:
        default: "low"

  - detect-cpu-set:
      cpu: ["all"]
      mode: "exclusive" # run detect threads in these cpus
      prio:
        default: "high"

The idea is to assign the highest prio to detect threads and to let the OS do its best
to dispatch the remaining work among the CPUs (balanced mode on all CPUs for the management).

Defrag

Some tuning was needed here. The network was exhibing some serious fragmentation
and we have to modify the default settings

defrag:
  memcap: 512mb
  trackers: 65535 # number of defragmented flows to follow
  max-frags: 65535  # number of fragments

The ‘trackers’ variable was not documented in the original YAML configuration file.
Although defined in the YAML, the ‘max-frags’ one was not used by Suricata. A patch
has been made to implement this.

Streaming

The variables relative to streaming have been set very high

stream:
  memcap: 12gb
  max-sessions: 20000000
  prealloc-sessions: 10000000
  inline: no                    # no inline mode
  reassembly:
    memcap: 14gb
    depth: 6mb                  # reassemble 1mb into a stream
    toserver-chunk-size: 2560
    toclient-chunk-size: 2560

To detect the potential issue with memcap, one can read the ‘stats.log’ file
which contains various counters. Some of them matching the ‘memcap’ string.

Running suricata

Suricata can now be runned with the usual command line

sudo suricata -c /etc/suricata.yaml --af-packet=eth3

Our affinity setup is working as planned as show the following log line

Setting prio -2 for "AFPacketeth34" Module to cpu/core 3, thread id 30415

Tests

Tests have been made by simply running Suricata against the massive traffic
mirrored on the eth3 interface.

At first, we started Suricata without rules to see if it was able to deal
with the amount of packets for a long period. Most of the tuning was done
during this phase.

To detect packet loss, the capture keyword can be search in ‘stats.log’.
If ‘kernel_drops’ is set to 0, this is good

capture.kernel_packets    | AFPacketeth315            | 1436331302
capture.kernel_drops      | AFPacketeth315            | 0
capture.kernel_packets    | AFPacketeth316            | 1449320230
capture.kernel_drops      | AFPacketeth316            | 0

The statistics are available for each thread. For example, ‘AFPacketeth315’ is
the 15th AFPacket thread bound to eth3.

When this phase was complete we did add some rules by using Emerging Threat PRO rules
for malware, trojan and some others:

rule-files:
 - trojan.rules
 - malware.rules
 - chat.rules
 - current_events.rules
 - dns.rules
 - mobile_malware.rules
 - scan.rules
 - user_agents.rules
 - web_server.rules
 - worm.rules

This ruleset has the following characterics:

  • 6719 signatures processed
  • 8 are IP-only rules
  • 2307 are inspecting packet payload
  • 5295 inspect application layer
  • 0 are decoder event only

This is thus a decent ruleset with a high part of application level event which require a
complex processing. With that ruleset, there is more than 16 alerts per second (output in unified2 format).

With the previously mentioned ruleset, the load of each CPU is around 60% and Suricata
is remaining stable during hours long run.

In most run, we’ve observed some packet loss between capture start and first time Suricata grab the statistics. It seems the initialization phase is not fast enough.

Conclusion

OISF team has access to the box for a week now and has already
managed to get real performance. We will continue to work on it to provide
the best possible experience to all Suricata’s users.

Feel free to made any remark and suggestion about this blog post and this setup.
Opensvp, a new tool to analyse the security of firewalls using ALGs

Following my talk at SSTIC, I’ve released a new tool called opensvp. Its aim is to cover the attacks described in this talk. It has been published to be able to determine if the firewall policy related to Application Layer Gateways is correctly implemented.

Opensvp implements two type of attacks:

  • Abusive usage of protocol commands: an protocol message can be forged to open pinhole into firewall. Opensvp currently implements message sending for IRC and FTP ALGs.
  • Spoofing attack: if anti-spooofing is not correctly setup, an attacker can send command which result in arbitrary pinhole being opened to a server.

It has been developed in Python and uses scapy to implement the spoofing attack on ALGs.

For usage and download, you can have a look at opensvp page. The attack against helpers is described in the README of opensvp.

The document “Secure use of iptables and connection tracking helpers” was published some months ago and it describes how to protect a Netfilter firewall when using connection tracking helpers (the Netfilter name for ALGs).

Transparents de ma présentation au SSTIC

Les transparents de ma présentation du SSTIC sont disponibles : Utilisation malveillante des suivis de connexions. Merci aux organisateurs du SSTIC d’avoir accepté mon papier!

Des vidéos de démonstration sont disponibles sur ce post: Playing with Network Layers to Bypass Firewalls’ Filtering Policy

L’outil de test openvsp est disponible sur cette page.

Using Scapy lfilter

Scapy BPF filtering is not working when some exotic interface are used. This includes Virtualbox interface such as vboxnet.

For example, the following code will not work if the interface is a virtualbox interface:

build_filter = "src host %s and src port 21"
sniff(iface=iface, prn=callback, filter=build_filter)

To fix this, you can use the lfilter option. The filtering is now done inside Scapy. This is powerful but less efficient.

The code can be modified like this:

build_lfilter = lambda (r): TCP in r and r[TCP].sport == 21 and r[IP].src == ip
sniff(iface=iface, prn=callback, lfilter=build_lfilter)

Tanks a lot to Guillaume Valadon for the tips!

Playing with Network Layers to Bypass Firewalls’ Filtering Policy

The slides of my CansecWest talk can now be downloaded: Playing with Network Layers to Bypass Firewalls’ Filtering Policy.

The required counter-measures are described in the Secure use of iptables and connection tracking helpers document

The associated video demonstrations are available:

First video demonstrates how to use forged IRC protocol command (DCC request) to be able to open connection to a NATed client from internet.

Second video demonstrates the effect of the attack on helpers on a non protected Netfilter Firewall.

Third video demonstrates the effect of the attack on helpers on a badly configured Checkpoint firewall.

More information will come in upcoming posts.

Ecosystem of Suricata

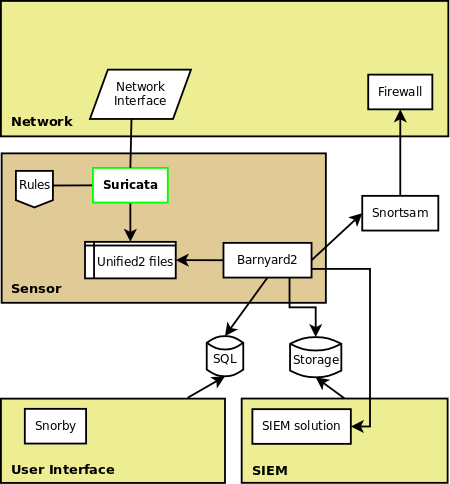
Suricata is an IDS/IPS engine. To build a complete solution, you will need to use other tools.

The following schema is a representation of a possible software setup in the case Suricata is used as IDS or IPS on the network. It only uses opensource components:

Suricata is used to sniff and analyse the traffic. To detect malicious traffic, it uses signatures (or rules). You can download a set of specialised rules from EmergingThreats.

To analyse the alerts generated by Suricata, you will need an interface such as, for example, snorby.

But this interface will need to have an access to the data. This is done by storing the alerts in a database. The feed of this database can be done by barnyard2 which take the files outputted by suricata in unified2 and convert and send them to a database (or to some other format).

If you want counter-measure to be taken (such as blocking for a moment attacker at the firewall level), you can use snortsam.

More complex setup can include interactions with a SIEM solution.

Securing Netfilter connection tracking helpers

Following the presentation I’ve made during the 8th Netfilter Workshop, it was decided to write a document containing the best practices for a secure use of iptables and connection tracking helpers.

This document called “Secure use of iptables and connection tracking helpers” is now available on this site. It contains recommendations that should be followed carefully if you are the administrator of a Netfilter/Iptables or the developer of a Netfilter based software.