Why you will love nftables

Linux 3.13 is out

Linux 3.13 is out bringing among other thing the first official release of nftables. nftables is the project that aims to replace the existing {ip,ip6,arp,eb}tables framework aka iptables.
nftables version in Linux 3.13 is not yet complete. Some important features are missing and will be introduced in the following Linux versions.
It is already usable in most cases but a complete support (read nftables at a better level than iptables) should be available in Linux 3.15.

nftables comes with a new command line tool named nft. nft is the successor of iptables and derivatives (ip6tables, arptables). And it has a completely different syntax.
Yes, if you are used to iptables, that’s a shock. But there is a compatibility layer that allow you to use iptables even if filtering is done with nftables in kernel.

There is only really few documentation available for now. You can find my nftables quick howto and there is some other initiatives that should be made public soon.

Some command line examples

Multiple targets on one line

Suppose you want to log and drop a packet with iptables, you had to write two rules. One for drop and one for logging:

iptables -A FORWARD -p tcp --dport 22 -j LOG
iptables -A FORWARD -p tcp --dport 22 -j DROP

With nft, you can combined both targets:

nft add rule filter forward tcp dport 22 log drop
Easy set creation

Suppose you want to allow packets for different ports and allow different icmpv6 types. With iptables, you need to use something like:

ip6tables -A INPUT -p tcp -m multiport --dports 23,80,443 -j ACCEPT
ip6tables -A INPUT -p icmpv6 --icmpv6-type neighbor-solicitation -j ACCEPT
ip6tables -A INPUT -p icmpv6 --icmpv6-type echo-request -j ACCEPT
ip6tables -A INPUT -p icmpv6 --icmpv6-type router-advertisement -j ACCEPT
ip6tables -A INPUT -p icmpv6 --icmpv6-type neighbor-advertisement -j ACCEPT

With nft, sets can be use on any element in a rule:

nft add rule ip6 filter input tcp dport {telnet, http, https} accept
nft add rule ip6 filter input icmpv6 type { nd-neighbor-solicit, echo-request, nd-router-advert, nd-neighbor-advert } accept

It is easier to write and it is more efficient on filtering side as there is only one rule added for each protocol.

You can also use named set to be able to make them evolve other time:

# nft -i # use interactive mode
nft> add set global ipv4_ad { type ipv4_address;}
nft> add element global ipv4_ad { 192.168.1.4, 192.168.1.5 }
nft> add rule ip global filter ip saddr @ipv4_ad drop

And later when a new bad boy is detected:

# nft -i
nft> add element global ipv4_ad { 192.168.3.4 }
Mapping

One advanced feature of nftables is mapping. It is possible to use to different type of data and to link them.
For example, we can associate iface and a dedicated rule set (stored in a chain and created before). In the example, the chains are named low_sec and high_sec:

# nft -i
nft> add map filter jump_map { type ifindex : verdict; }
nft> add element filter jump_map { eth0 : jump low_sec; }
nft> add element filter jump_map { eth1 : jump high_sec; }
nft> add rule filter input iif vmap @jump_map

Now, let’s say you have a new dynamic interface ppp1, it is easy to setup filtering for it. Simply add it in the jump_map mapping:

nft> add element filter jump_map { ppp1 : jump low_sec; }

On administration and kernel side

More speed at update

Adding a rule in iptables was getting dramatically slower with the number of rules and that’s explained why script using iptables call are taking a long time to complete. This is not anymore with nftables which is using atomic and fast operation to update rule sets.

Less kernel update

With iptables, each match or target was requiring a kernel module. So, you had to recompile kernel in case you forgot something or want to use something new.
this is not anymore the case with nftables. In nftables, most work is done in userspace and kernel only knows some basic instruction (filtering is implemented in a pseudo-state machine).
For example, icmpv6 support has been achieved via a simple patch of the nft tool.
This type of modification in iptables would have required kernel and iptables upgrade.
A bit of logstash cooking

Introduction

I’m running a dedicated server to host some internet services. The server runs Debian. I’ve installed logstash on it to do a bit of monitoring of my system logs and suricata.

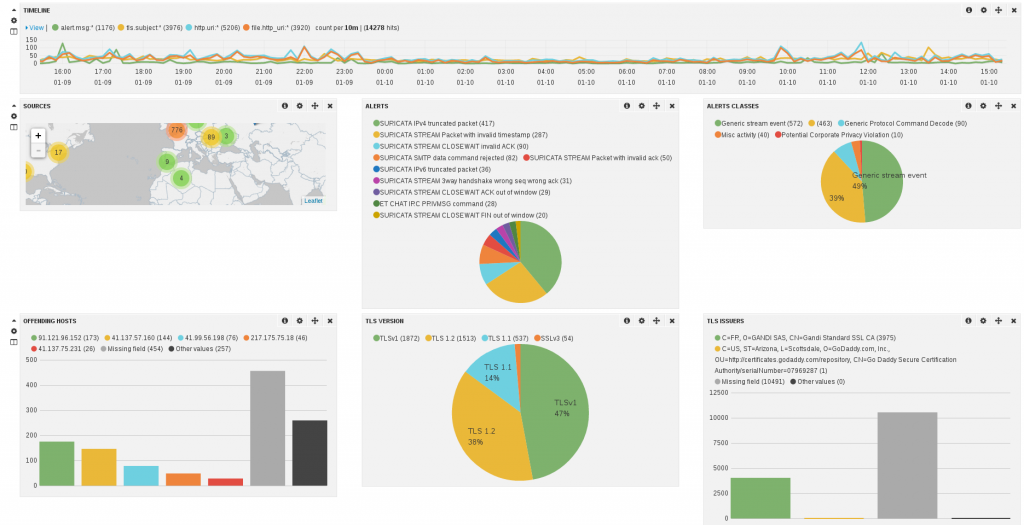
I’ve build a set of dashboards. The screenshot below shows a part of the one being dedicated to suricata:
Suricata dashboard

Setup

My data sources were the following:

  • System logs
  • Apache logs
  • Suricata full JSON logs (should be available in suricata 2.0)
System logs

The setup was mostly really easy. I’ve just added a grok pattern to detect successful and unsuccessful connections on the ssh server.

input {
  file {
    type => "linux-syslog"
    path => [ "/var/log/daemon.log", "/var/log/auth.log", "/var/log/mail.info" ]
  }
filter {
  if [type] == "linux-syslog" {
      grok {
        match => { "message" => "Accepted %{WORD:auth_method} for %{USER:username} from %{IP:src_ip} port %{INT:src_port} ssh2" }
      }
      grok {
        match => { "message" => "Invalid user %{USER:username} from %{IP:src_ip}" }
      }
  }
}
Apache logs

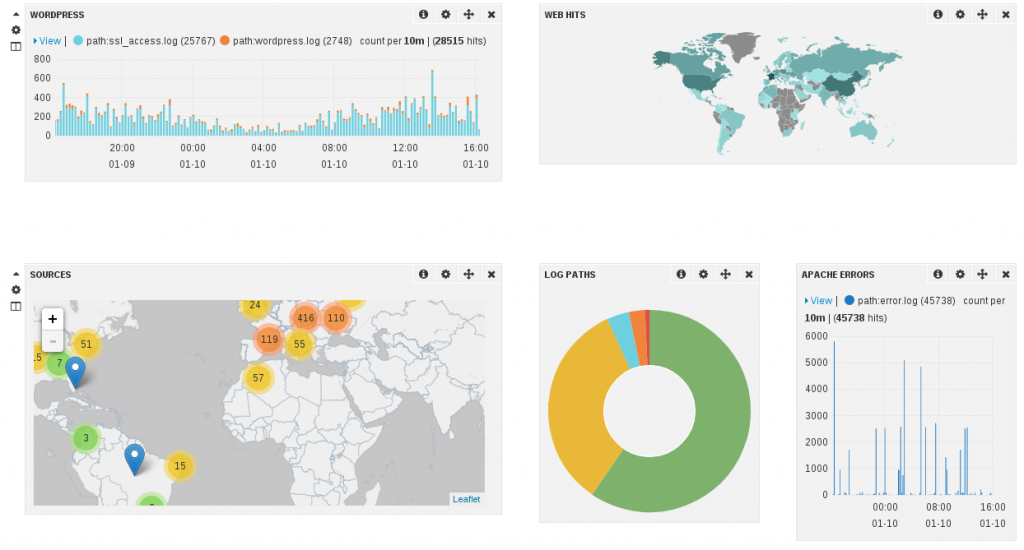
Extract of Apache Dashboard

For apache, it was even easier for access.log:

  file {
    path => [ "/var/log/apache2/*access.log" ]
    type => "apache-access"
  }

  file {
    type => "apache-error"
    path => "/var/log/apache2/error.log"
  }
}
filter {
  if [type] == "apache-access" {
      grok {
        match => { "message" => "%{COMBINEDAPACHELOG}" }
      }
  }

  if [type] == "apache-error" {
      grok {
        match => { "message" => "%{APACHEERRORLOG}" }
        patterns_dir => ["/var/lib/logstash/etc/grok"]
      }
  }
}

For error log, I’ve created a grok pattern to get client IP. So I’ve created a file in grok dir with:

HTTPERRORDATE %{DAY} %{MONTH} %{MONTHDAY} %{TIME} %{YEAR}
APACHEERRORLOG \[%{HTTPERRORDATE:timestamp}\] \[%{WORD:severity}\] \[client %{IPORHOST:clientip}\] %{GREEDYDATA:message_remainder}
Netfilter logs

Extract of firewall Dashboard

For Netfilter logs, I’ve decided to play it the old way and to parse kernel log instead of using ulogd:

input {
  file {
    type => "kern-log"
    path => "/var/log/kern.log"
  }
}

filter {
 if [type] == "kern-log" {
        grok {
                match => { "message" => "%{IPTABLES}"}
                patterns_dir => ["/var/lib/logstash/etc/grok"]
        }
 }
}

with IPTABLES being defined in a file placed in the grok directory and containing:

 NETFILTERMAC %{COMMONMAC:dst_mac}:%{COMMONMAC:src_mac}:%{ETHTYPE:ethtype}
 ETHTYPE (?:(?:[A-Fa-f0-9]{2}):(?:[A-Fa-f0-9]{2}))
 IPTABLES1 (?:IN=%{WORD:in_device} OUT=(%{WORD:out_device})? MAC=%{NETFILTERMAC} SRC=%{IP:src_ip} DST=%{IP:dst_ip}.*(TTL=%{INT:ttl})?.*PROTO=%{WORD:proto}?.*SPT=%{INT:src_port}?.*DPT=%{INT:dst_port}?.*)
 IPTABLES2 (?:IN=%{WORD:in_device} OUT=(%{WORD:out_device})? MAC=%{NETFILTERMAC} SRC=%{IP:src_ip} DST=%{IP:dst_ip}.*(TTL=%{INT:ttl})?.*PROTO=%{INT:proto}?.*)
 IPTABLES (?:%{IPTABLES1}|%{IPTABLES2})

Exim logs

Extract of SMTP dashboard

This part was complicated because exim logs are multiline. So I found a page explaining how to match at least, the logs for delivered mail.
It is using multiline in filter.
Then I added a series of matches to get more information. Each match do only get a part of a message so I’ve used break_on_match not to exit
when one of the match succeed.

input {
  file {
    type => "exim-log"
    path => "/var/log/exim4/mainlog"
  }
}
filter {
  if [type] == "exim-log" {
      multiline {
        pattern => "%{DATE} %{TIME} %{HOSTNAME:msgid} (=>|Completed)"
        what => "previous"
      }
      grok {
        break_on_match => false
        match => [
          "message", "<= %{NOTSPACE:from} H=%{NOTSPACE:server} \[%{IP:src_ip}\]"
        ]
      }
      grok {
        break_on_match => false
        match => [
          "message", "=> %{USERNAME:username} <%{NOTSPACE:dest}> R=%{WORD:transport}"
        ]
      }

      grok {
        break_on_match => false
        match => [
          "message", "=> %{NOTSPACE:dest} R=%{WORD:transport}"
        ]
     }
      grok {
        break_on_match => false
        match => [
          "message", "%{DATE} %{TIME} H=%{NOTSPACE:server}%{GREEDYDATA} \[%{IP:src_ip}\] F=<%{NOTSPACE:mail_to}> temporarily rejected RCPT <%{NOTSPACE:dest}>: greylisted"
        ]
      }
   }
}
Suricata

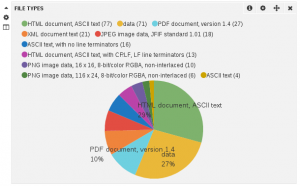
Pie with file types

Suricata full JSON output is JSON so the configuration in logstash is trivial:

input {
   file {
      path => ["/var/log/suricata/eve.json" ]
      codec =>   json
   }
}

You can download a sample Suricata Dashboard to use in in your logstash installation.

The full configuration

Below is the full configuration. There is only one thing which I did not mention. For most source IP, I use geoip to have an idea of the localisation of the IP.

input {
  file {
    type => "linux-syslog"
    path => [ "/var/log/daemon.log", "/var/log/auth.log", "/var/log/mail.info" ]
  }

  file {
    path => [ "/var/log/apache2/*access.log" ]
    type => "apache-access"
  }

  file {
    type => "apache-error"
    path => "/var/log/apache2/error.log"
  }

  file {
    type => "exim-log"
    path => "/var/log/exim4/mainlog"
  }

  file {
    type => "kern-log"
    path => "/var/log/kern.log"
  }

   file {
      path => ["/var/log/suricata/eve.json" ]
      codec =>   json
   }

}

filter {
  if [type] == "apache-access" {
      grok {
        match => { "message" => "%{COMBINEDAPACHELOG}" }
      }
  }
  if [type] == "linux-syslog" {
      grok {
        match => { "message" => "Accepted %{WORD:auth_method} for %{USER:username} from %{IP:src_ip} port %{INT:src_port} ssh2" }
      }
  }

  if [type] == "apache-error" {
      grok {
        match => { "message" => "%{APACHEERRORLOG}" }
        patterns_dir => ["/var/lib/logstash/etc/grok"]
      }
  }

  if [type] == "exim-log" {
      multiline {
        pattern => "%{DATE} %{TIME} %{HOSTNAME:msgid} (=>|Completed)"
        what => "previous"
      }
      grok {
        break_on_match => false
        match => [
          "message", "<= %{NOTSPACE:from} H=%{NOTSPACE:server} \[%{IP:src_ip}\]"
        ]
      }
      grok {
        break_on_match => false
        match => [
          "message", "=> %{USERNAME:username} <%{NOTSPACE:dest}> R=%{WORD:transport}"
        ]
      }

      grok {
        break_on_match => false
        match => [
          "message", "=> %{NOTSPACE:dest} R=%{WORD:transport}"
        ]
     }
      grok {
        break_on_match => false
        match => [
          "message", "%{DATE} %{TIME} H=%{NOTSPACE:server}%{GREEDYDATA} \[%{IP:src_ip}\] F=<%{NOTSPACE:mail_to}> temporarily rejected RCPT <%{NOTSPACE:dest}>: greylisted"
        ]
      }
   }

 if [type] == "kern-log" {
        grok {
                match => { "message" => "%{IPTABLES}"}
                patterns_dir => ["/var/lib/logstash/etc/grok"]
        }
 }

  if [src_ip]  {
    geoip {
      source => "src_ip"
      target => "geoip"
      add_field => [ "[geoip][coordinates]", "%{[geoip][longitude]}" ]
      add_field => [ "[geoip][coordinates]", "%{[geoip][latitude]}"  ]
    }
    mutate {
      convert => [ "[geoip][coordinates]", "float" ]
    }
  }

  if [clientip]  {
    geoip {
      source => "clientip"
      target => "geoip"
      add_field => [ "[geoip][coordinates]", "%{[geoip][longitude]}" ]
      add_field => [ "[geoip][coordinates]", "%{[geoip][latitude]}"  ]
    }
    mutate {
      convert => [ "[geoip][coordinates]", "float" ]
    }
  }

  if [srcip]  {
    geoip {
      source => "srcip"
      target => "geoip"
      add_field => [ "[geoip][coordinates]", "%{[geoip][longitude]}" ]
      add_field => [ "[geoip][coordinates]", "%{[geoip][latitude]}"  ]
    }
    mutate {
      convert => [ "[geoip][coordinates]", "float" ]
    }
  }
}

output {
  stdout { codec => rubydebug }
  elasticsearch { embedded => true }
}

What’s new in ulogd 2.0.3

New features in ulogd 2.0.3 release

Database framework update

ulogd 2.0.3 implements two new optional modes for database connections:

  • backlog system to avoid event loss in case of database downtime
  • running mode where acquisition is made in one thread and queries to databases are made in separate threads to reduce latency in the treatment of kernel messages

These two modes are described below.

Postgresql update

Postgresql output plugin was only offering a small subset of Postgresql connection-related options.
It is now possible to use the connstring to use all possible parameters of libpq param keywords. If set, this variable has precedence on other variables.

One interest of connstring is to be able to use a SSL-encrypted connection to the database by using the sslmode keyword:

connstring="host=localhost port=4321 dbname=nulog user=nupik password=changeme sslmode=verify-full sslcert=/etc/ssl/pgsql-cert.pem sslkey=/etc/ssl/pgsql-key.pem sslrootcert==/etc/ssl/pgsql-rootcert.pem"

Event loss prevention

ulogd 2.0.3 implements a backlog system for all database output plugins using the abstraction framework for database connection. At the writing of this article, this is MySQL, PostgreSQL and DBI. Memory will be dedicated to store the queries that can not be run because of an unavailability of the database. Once the database is back, the queries are played in order.

To activate this mode, you need to set the backlog_memcap value in the database definition.

[mysql1]
db="nulog"
...
procedure="INSERT_PACKET_FULL"
backlog_memcap=1000000
backlog_oneshot_requests=10

Set backlog_memcap to the size of memory that will be allocated to store events in memory if data is temporary down. The variable backlog_oneshot_requests is storing the number of queries to process at once before reading a kernel message.

Multithreaded database output

If the ring buffer mode is active, a thread will be created for each stack involving the configured database. It will connect to the database and execute the queries.
The idea is to try to avoid buffer overrun by minimizing the time requested to treat kernel message. Doing synchronous SQL request, as it was made before was causing a delay which could cause some messages to be lost in case of burst from kernel side. With this new mode, the time to process kernel message is equal to the time of the formatting of the query.

To activate this mode, you need to set ring_buffer_size to a value superior to 1.
The value stores the number of SQL requests to keep in the ring buffer.

[pgsql1]
db="nulog"
...
procedure="INSERT_PACKET_FULL"
ring_buffer_size=1000

The ring_buffer_size has precedence on the backlog_memcap value. And backlog will be disabled if the ring buffer is active as ring buffer also provide packet loss prevention. ring_buffer_size is the maximum number of queries to keep in memory.

Using linux perf tools for Suricata performance analysis

Introduction

Perf is a great tool to analyse performances on Linux boxes. For example, perf top will give you this type of output on a box running Suricata on a high speed network:

Events: 32K cycles                                                                                                                                                                                                                            
 28.41%  suricata            [.] SCACSearch
 19.86%  libc-2.15.so        [.] tolower
 17.83%  suricata            [.] SigMatchSignaturesBuildMatchArray
  6.11%  suricata            [.] SigMatchSignaturesBuildMatchArrayAddSignature
  2.06%  suricata            [.] tolower@plt
  1.70%  libpthread-2.15.so  [.] pthread_mutex_trylock
  1.17%  suricata            [.] StreamTcpGetFlowState
  1.10%  libc-2.15.so        [.] __memcpy_ssse3_back
  0.90%  libpthread-2.15.so  [.] pthread_mutex_lock

The functions are sorted by CPU consumption. Using arrow key it is possible to jump into the annotated code to see where most CPU cycles are used.

This is really useful but in the case of a function like pthread_mutex_trylock, the interesting part is to be able to find where this function is called.

Getting function call graph in perf

This stack overflow question lead me to the solution.

I’ve started to build suricata with the -fno-omit-frame-pointer option:

./configure --enable-pfring --enable-luajit CFLAGS="-fno-omit-frame-pointer"
make
make install

Once suricata was restarted (with pid being 9366), I was then able to record the data:

sudo perf record -a --call-graph -p 9366

Extracting the call graph was then possible by running:

sudo perf report --call-graph --stdio

The result is a huge detailed report. For example, here’s the part on pthread_mutex_lock:

     0.94%  Suricata-Main  libpthread-2.15.so     [.] pthread_mutex_lock
            |
            --- pthread_mutex_lock
               |
               |--48.69%-- FlowHandlePacket
               |          |
               |          |--53.04%-- DecodeUDP
               |          |          |
               |          |          |--95.84%-- DecodeIPV4
               |          |          |          |
               |          |          |          |--99.97%-- DecodeVLAN
               |          |          |          |          DecodeEthernet
               |          |          |          |          DecodePfring
               |          |          |          |          TmThreadsSlotVarRun
               |          |          |          |          TmThreadsSlotProcessPkt
               |          |          |          |          ReceivePfringLoop
               |          |          |          |          TmThreadsSlotPktAcqLoop
               |          |          |          |          start_thread
               |          |          |           --0.03%-- [...]
               |          |          |
               |          |           --4.16%-- DecodeIPV6
               |          |                     |
               |          |                     |--97.59%-- DecodeTunnel
               |          |                     |          |
               |          |                     |          |--99.18%-- DecodeTeredo
               |          |                     |          |          DecodeUDP
               |          |                     |          |          DecodeIPV4
               |          |                     |          |          DecodeVLAN
               |          |                     |          |          DecodeEthernet
               |          |                     |          |          DecodePfring
               |          |                     |          |          TmThreadsSlotVarRun
               |          |                     |          |          TmThreadsSlotProcessPkt
               |          |                     |          |          ReceivePfringLoop
               |          |                     |          |          TmThreadsSlotPktAcqLoop
               |          |                     |          |          start_thread
               |          |                     |          |
               |          |                     |           --0.82%-- DecodeIPV4
               |          |                     |                     DecodeVLAN
               |          |                     |                     DecodeEthernet
               |          |                     |                     DecodePfring
               |          |                     |                     TmThreadsSlotVarRun
               |          |                     |                     TmThreadsSlotProcessPkt
               |          |                     |                     ReceivePfringLoop
               |          |                     |                     TmThreadsSlotPktAcqLoop
               |          |                     |                     start_thread
               |          |                     |
               |          |                      --2.41%-- DecodeIPV6
               |          |                                DecodeTunnel
               |          |                                DecodeTeredo
               |          |                                DecodeUDP
               |          |                                DecodeIPV4
               |          |                                DecodeVLAN
               |          |                                DecodeEthernet
               |          |                                DecodePfring
               |          |                                TmThreadsSlotVarRun
               |          |                                TmThreadsSlotProcessPkt
               |          |                                ReceivePfringLoop
               |          |                                TmThreadsSlotPktAcqLoop
               |          |                                start_thread

Logstash and Suricata for the old guys

Introduction

logstash an opensource tool for managing events and logs. It is using elasticsearch for the storage and has a really nice interface named Kibana. One of the easiest to use entry format is JSON.

Suricata is an IDS/IPS which has some interesting logging features. Version 2.0 will feature a JSON export for all logging subsystem. It will then be possible to output in JSON format:

  • HTTP log
  • DNS log
  • TLS log
  • File log
  • IDS Alerts

For now, only File log is available in JSON format. This extract meta data from files transferred over HTTP.

Peter Manev has described how to connect Logstash Kibana and Suricata JSON output. Installation is really simple, just download logstash from logstash website, write your configuration file and start the thing.

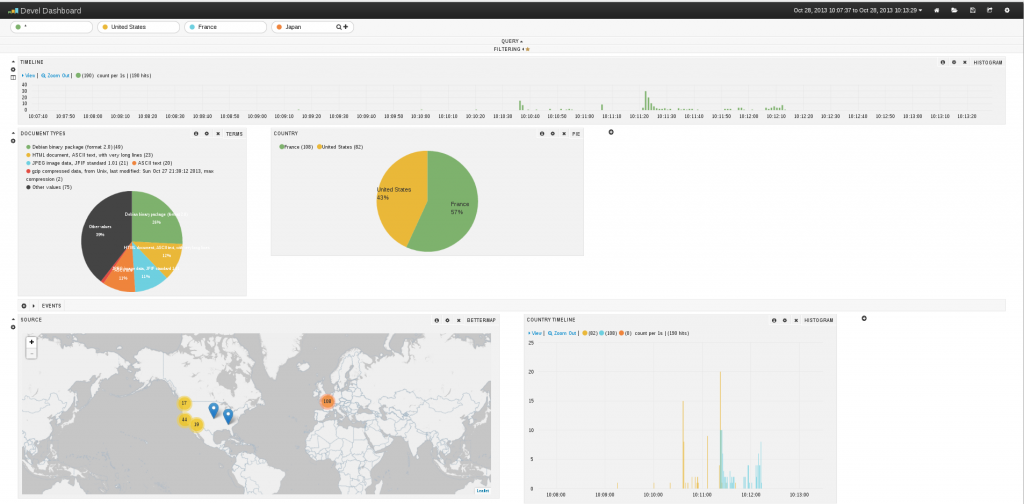
Kibana interface is really impressive:
Kibana Screenshot

But at the time, I started to look at the document, a few things were missing:

  • Geoip is not supported
  • All fields containing space appear as multiple entries

Geoip support

This one was easy. You simply have to edit the logstash.conf file to add a section about geoip:

input {
  file { 
    path => "/home/eric/builds/suricata/var/log/suricata/files-json.log" 
    codec =>   json 
    # This format tells logstash to expect 'logstash' json events from the file.
    #format => json_event 
  }
}

output { 
  stdout { codec => rubydebug }
  elasticsearch { embedded => true }
}

#geoip part
filter {
  if [srcip] {
    geoip {
      source => "srcip"
      target => "geoip"
      add_field => [ "[geoip][coordinates]", "%{[geoip][longitude]}" ]
      add_field => [ "[geoip][coordinates]", "%{[geoip][latitude]}"  ]
    }
    mutate {
      convert => [ "[geoip][coordinates]", "float" ]
    }
  }
}

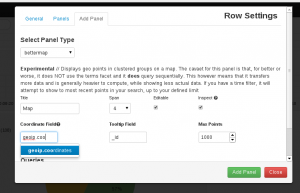
It adds a filter that check for presence of srcip and add geoip information to the entry. The tricky thing is the add_field part that create an array that has to be used when adding a map to kibana dashboard. See following screenshot for explanation:
Creating new map in Kibana

You may have the following error:

You must specify 'database => ...' in your geoip filter"

In this case, you need to specify the path to the geoip database by adding the database keyword to geoip configuration:

#geoip part
filter {
  if [srcip] {
    geoip {
      source => "srcip"
      target => "geoip"
      database => "/path/to/GeoLiteCity.dat"
      add_field => [ "[geoip][coordinates]", "%{[geoip][longitude]}" ]
      add_field => [ "[geoip][coordinates]", "%{[geoip][latitude]}"  ]
    }
    mutate {
      convert => [ "[geoip][coordinates]", "float" ]
    }
  }
}

Once the file is written, you can start logstash

java -jar /home/eric/builds/logstash/logstash-1.2.2-flatjar.jar agent -f /home/eric/builds/logstash/logstash.conf --log /home/eric/builds/logstash/log/logstash-indexer.out -- web

See Logstash Kibana and Suricata JSON output for detailed information on setup.

Logstash indexing and mapping

Before logstash 1.3.1, fixing the space issue was really complex. Since that version, all indexed fields are provided with a .raw field that can be used to avoid the problem with spaces in name. So now, you can simply use in Kibana something like geoip.country_name.raw in the definition of graph instead of geoip.country_name. Doing that United States does not appear anymore as United and States.

Fixing the space issue for lostash previous to 1.3.1 was far more complicated for an old guy like me used to configuration files. If finding the origin of the behavior is easy fixing it was more painful. A simple googling shows me that by default elasticsearch storage split string at spaces when indexing. To fix this, you have to specify that the field should not be analyzed during indexing: "index":"not_analyzed"

That was looking easy at first but logstash is not using a configuration file for indexing and mapping. In fact, you need to interact with elasticsearch via HTTP requests. Second problem is that the index are dynamically generated, so there is a template system that you can use to have indexes created the way you want.

Creating an template is easy. You simply do something like:

curl -XPUT http://localhost:9200/_template/logstash_per_index -d '
{
    "template" : "logstash*",
    MAGIC HERE
}'

This will create a template that will be applied to all newly created indexes with name matching “logstash*”. The difficult part is to know what to to put in MAGIC HERE and to check if “logstash*” will match created index. To check this, you can retrieve all current mappings:

curl -XGET 'http://localhost:9200/_all/_mapping'

You then get a list of mappings and you can check the name. But best part is that you can get a base text to update the mapping definition part. With Suricata file log and geoip activated, the following configuration is working well:

curl -XPUT http://localhost:9200/_template/logstash_per_index -d '
{
    "template" : "logstash*",
    "mappings" : {
      "logs" : {
         "properties": {
            "@timestamp":{"type":"date",
            "format":"dateOptionalTime"},
            "@version":{"type":"string"},
            "dp":{"type":"long"},
            "dstip":{"type":"ip"},
            "filename":{"type":"string"},
            "geoip":{
               "properties":{
                  "area_code":{"type":"long"},
                  "city_name":{"type":"string", "index":"not_analyzed"},
                  "continent_code":{"type":"string"},
                  "coordinates":{"type":"string"},
                  "country_code2":{"type":"string"},
                  "country_code3":{"type":"string"},
                  "country_name":{"type":"string", "index":"not_analyzed"},
                  "dma_code":{"type":"long"},
                  "ip":{"type":"string"},
                  "latitude":{"type":"double"},
                  "longitude":{"type":"double"},
                  "postal_code":{"type":"string"},
                  "real_region_name":{"type":"string", "index":"not_analyzed"},
                  "region_name":{"type":"string", "index":"not_analyzed"},
                  "timezone":{"type":"string"}
               }
            },
            "host":{"type":"string"},
            "http_host":{"type":"string"},
            "http_referer":{"type":"string"},
            "http_uri":{"type":"string"},
            "http_user_agent":{"type":"string", "index":"not_analyzed", "omit_norms":true, "index_options":"docs"},
            "ipver":{"type":"long"},
            "magic":{"type":"string", "index":"not_analyzed", "omit_norms":true, "index_options":"docs"},
            "md5":{"type":"string"},
            "path":{"type":"string"},
            "protocol":{"type":"long"},
            "size":{"type":"long"},
            "sp":{"type":"long"},
            "srcip":{"type":"ip"},
            "state":{"type":"string"},
            "stored":{"type":"boolean"},
            "tags":{"type":"string"},
            "timestamp":{"type":"string"}
      }
    }
  }
}'

I’ve added some “index”:”not_analyzed” and improved the type for some of the fields. For example, srcip has been defined as an IP address. This allow to do range searching in Kibana like

["192.168.42.24" TO "192.168.42.45"]

Next point is to update the index format. To to so, you can get the name of current index, delete it and recreate it. To get the name you can use le mapping listing:

curl -XGET 'http://localhost:9200/_all/_mapping'

The return is something like:

{"logstash-2013.10.27":{"logs":{"properties":

So now, we can destroy this index named “logstash-2013.10.27” and have it recreated with the correct
settings:

curl -XDELETE 'http://localhost:9200/logstash-2013.10.27'
curl -XPUT 'http://localhost:9200/logstash-2013.10.27'

We need data to be reindexed so:

curl -XGET 'http://localhost:9200/logstash-2013.10.27/_refresh'

It may also be a good idea to wait for new data as it seems to trigger update in what elasticsearch is sending.

A bit of fun with IPv6 setup

When doing some tests on Suricata, I needed to setup a small IPv6 network. The setup is simple with one laptop which is Ethernet connected to a desktop. And the desktop host a Virtualbox system.
This way, the desktop can act as a router with laptop on eth0 and Vbox on vboxnet0.

To setup the desktop/router, I’ve used:

ip a a 4::1/64 dev eth0
ip a a 2::1/64 dev vboxnet0
echo "1">/proc/sys/net/ipv6/conf/all/forwarding

To setup the laptop who already has a IPv6 public address on eth0, I’ve done:

ip a a 4::4/64 dev wlan0
ip -6 r a 2::2/128 via 4::1 src 4::2 metric 128

Almost same thing on the Vbox:

ip a a 2::2/64 dev eth0
ip -6 r a default via 2::1

This setup should be enough but when I tried to do from the laptop:

ping6 2::2

I got a failure.

I then checked the routing on the laptop:

# ip r g 2::2
2::2 via 4::1 dev wlan0  src 2a01:e35:1394:5bd0:f8b3:5a98:2715:6c8d  metric 128

A public IPv6 address is used as source address and this is confirmed by a tcpdump on the desktop:

# tcpdump -i eth0 icmp6 -nv
10:54:48.841761 IP6 (hlim 64, next-header ICMPv6 (58) payload length: 64) 2a01:e35:1394:5bd0:f8b3:5a98:2715:6c8d > 4::1: [icmp6 sum ok] ICMP6, echo request, seq 11

And the desktop does not know how to reach this IP address because it does not have a public IPv6 address.

On the laptop, I’ve dumped wlan0 config to check the address:

# ip a l dev wlan0
3: wlan0:  mtu 1500 qdisc mq state UP group default qlen 1000
    link/ether c4:85:08:33:c4:c8 brd ff:ff:ff:ff:ff:ff
    inet 192.168.1.137/24 brd 192.168.1.255 scope global wlan0
       valid_lft forever preferred_lft forever
    inet6 4::4/64 scope global
       valid_lft forever preferred_lft forever
    inet6 2a01:e35:1434:5bd0:f8b3:5a98:2715:6c8d/64 scope global temporary dynamic
       valid_lft 86251sec preferred_lft 84589sec
    inet6 2a01:e35:1434:5bd0:c685:8ff:fe33:c4c8/64 scope global dynamic
       valid_lft 86251sec preferred_lft 86251sec
    inet6 fe80::c685:8ff:fe33:c4c8/64 scope link
       valid_lft forever preferred_lft forever

And, yes, 2a01:e35:1394:5bd0:f8b3:5a98:2715:6c8d is a dynamic IPv6 address which is used by default to get out (and bring a little privacy).

Deleting the address did fix the ping issue:

# ip a d 2a01:e35:1394:5bd0:f8b3:5a98:2715:6c8d/64 dev wlan0
# ping6 2::2
PING 2::2(2::2) 56 data bytes
64 bytes from 2::2: icmp_seq=1 ttl=63 time=5.47 ms

And getting the route did confirm the fix was working:

# ip r g 2::2
2::2 via 4::1 dev wlan0  src 4::4  metric 128 

All that to say, that it can be useful to desactivate temporary IPv6 address before setting up a test network:

echo "0" > /proc/sys/net/ipv6/conf/wlan0/use_tempaddr

Talk about nftables at Kernel Recipes 2013

I’ve just gave a talk about nftables, the iptables successor, at Kernel Recipes 2013. You can find the slides here:
2013_kernel_recipes_nftables

A description of the talk as well as slides and video are available on Kernel Recipes website

Here’s the video of my talk:

I’ve presented a video of nftables source code evolution:

The video has been generated with gource. Git history of various components have been merged and the file path has been prefixed with project name.

Adding a force build to all builders

Recent versions of buildbot, the continuous integration framework don’t allow by default the force build feature.
This feature can be used to start a build on demand. It is really useful when you’ve updated the build procedure or when you want to test new branches.

It was a little tricky to add it, so I decided to share it. If c is the name of the configuration you build in your master.cfg, you can add after all builders declarations:

from buildbot.schedulers.forcesched import *
c['schedulers'].append(ForceScheduler(name="force", 
                       builderNames = [ builder.getConfigDict()['name'] for builder in c['builders'] ]))

As was saying one of my physic teacher: “easy when you’ve done it once”.

Using tc with IPv6 and IPv4

The first news is that it works! It is possible to use tc to setup QoS on IPv6 but the filter have to be updated.

When working on adding IPv6 support to lagfactory, I found out by reading tc sources and specifically ll_proto.c that the keyword to use for IPv6 was ipv6. Please read that file if you need to find the keyword for an other protocol.
So to send packet with Netfilter mark 5000 to a specific queue, one can use:

/sbin/tc filter add dev vboxnet0 protocol ipv6 parent 1:0 prio 3 handle 5000 fw flowid 1:3

All would have been simple, if I was not trying to have IPv6 and IPv4 support. My first try was to simply do:

${TC} filter add dev ${IIF} protocol ip parent 1:0 prio 3 handle 5000 fw flowid 1:3
${TC} filter add dev ${IIF} protocol ipv6 parent 1:0 prio 3 handle 5000 fw flowid 1:3

But the result was this beautiful message:

RTNETLINK answers: Invalid argument
We have an error talking to the kernel

Please note the second message displayed that warn you you talk to rudely to kernel and that he just kick you out the room.

The fix is simple. In fact, you can not use twice the same prio. So it is successful to use:

${TC} filter add dev ${IIF} protocol ip parent 1:0 prio 3 handle 5000 fw flowid 1:3
${TC} filter add dev ${IIF} protocol ipv6 parent 1:0 prio 4 handle 5000 fw flowid 1:3

Some ulogd db improvements

Some new features

I’ve just pushed to ulogd tree a series of patches. They bring two major improvements to database handling:

  • Backlog system: temporary store SQL query in memory if database is down.
  • Ring buffer system: a special mode with a thread to read data from kernel and a thread to do the SQL query.

The first mode is attended for preventing data loss when database is temporary down. The second one is an attempt to improve performance and the resistance to netlink buffer overrun problem.
The modification has been done in the database abstraction layer and it is thus available in MySQL, PostgreSQL and DBI.

Backlog system

To activate this mode, you need to set the backlog_memcap value in the database definition.

[mysql1]
db="nulog"
...
procedure="INSERT_PACKET_FULL"
backlog_memcap=1000000
backlog_oneshot_requests=10

The backlog system will prevent data loss by storing queries in memory instead of executing them. The waiting queries will be run in order when the connection to the database is restored.

Ring buffer setup

To activate this mode, you need to set ring_buffer_size to a value superior to 1.
The value stores the number of SQL requests to keep in the ring buffer.

[pgsql1]
db="nulog"
...
procedure="INSERT_PACKET_FULL"
ring_buffer_size=1000

The ring_buffer_size has precedence on the backlog_memcap value. And backlog will be disabled if the ring buffer is active.

If the ring buffer mode is active, a thread will be created for each stack involving the configured database. It will connect to the database and execute the queries.
The idea is to try to avoid buffer overrun by minimizing the time requested to treat kernel message. Doing synchronous SQL request, as it was made before was causing a delay which could cause some messages to be lost in case of burst from kernel side.

Conclusion

Feel free to test it and don’t hesitate to provide some feedback!