Jozsef Kadlecsik, Faster firewalling with ipset

Why ipset ?

iptables is enough sufficient but in some cases limit are found:

  • High number of rules: iptables is linear
  • Need to change the rules often

Independant study available at d(a)emonkeeper’s purgatory has shown that the performance of ipset are almost constant with respect to the number of filtered hosts:

History

The originating project was ippool featuring a a basic set and after some time it has been taken over by Jozsef and renamed ipset. A lot of type of sets are now handled.

ipset 6.x is the current version and features an impressive number of sets.

Architecture

The communication between kernel and userspace is made via netlink

It is not possible to delete a set if it is referenced in kernel by iptables. So it may be appear as a problem but it is possible to use renaming and swapping operation to fix the issue.

The set type are numerous as pointed out here: ipset feature

Using different sets, it is possible to express a global policy in a few iptables rules.

Thanks to Florian Westphal, it is possible to access to set in tc.

Future of ipset

It will soon be possible to have per-element counters and this will allow to do some interesting accounting.

Patrick McHardy: Oops, I did it: IPv6 NAT

Introduction

Harald Welte when asked about IPv6 NAT was answering: “it will be over my dead body”. It is now available in official kernel.

Reasons for adding IPv6 NAT

  • Dynamic IPv6 Prefixes : ISP assigning dynamic IPv6 prefixes so Internal network address change. NAT can bring you stability.
  • Easier test setup.
  • Users are asking and most operating systems have it.

To resume the arguments of NAT, Patrick McHardy used this video:

A single, clean, bug free implementation is better than a lot of incomplete non official implementations that where already available.

Release and implementation

It has been implemented in 2011 and merged in 2.6.37.

It is mainly based to on IPv4 implementation and provide from a user perspective a interface similar to IPv4.

It also features an implementation of RFC 6296: stateless network prefix translation. It operates on a packet base and is completely stateless.

It is implemented as an ip6tables target SNPT and DNPT which have to be used on both way to handle the modifications required by RFC 6296.

Current work

An implementation of NAT64 is currently in progress and should be available in the coming weeks.

Pablo Neira Ayuso: nftables, a new packet filtering framework for Netfilter

Introduction

nftable is a kernel packet filtering framework to replaces iptables. It brings no changes in the core (conntrack, hooks).

Match logic is changed: you fetch keys and once you have your key set, you make operation on them. Advanced and specialized matchs are built upon this system.

nftables vs iptables

In iptables, extension were coded in separate files and they must be put in iptables source tree. To act, they must modify on a binary array storing the ruleset and injecting it back to the kernel. So every update involve a full download and upload of the whole ruleset.

nftables is working on a message based basis (exchanged via netlink) and thus allow better handling of incremental modification.

Nftables usage

nftables will provide a high level library which can be used to manipulate ruleset in dedicated tools.

From userspace, backward compatibility is here with utilities fully compatible iptables and ip6tables. Even script wil not have been changed

But there is some new things brought by the change:

  • event notifications: can have a software listening to rules change and logging the change. This is an interesting feature as tracability is often asked in secure environment
  • Better incremental rule update support
  • Enable or disable the chains per table you want (will provide performance optimisation)

There is work in progress on a new utility nft. It will provide a new syntax that will allow to do more efficient matching. It will be possible to form couple of keys and do high speed matching on them.

Ulogd 2.0.2, my first release as maintainer

Objectives of this release

So it is my first ulogd2 release as maintainer. I’ve been in charge of the project since 2012 October 30th and this was an opportunity for me to increase my developments on the project. Roadmap was almost empty so I’ve decided to work on issues that were bothering me as a user of the project. I’ve also included two features which are connection tracking event filtering and a Graphite output module. Ulogd is available on Netfilter web site

Conntrack event filtering

When logging connections entries, there is potentially a lot of events. Filtering the events on network parameters is thus a good idea. This can now be done via a series of options:

  • accept_src_filter: log only a connection if source ip of connection belong to the specified networks. This can be a list of network for example 192.168.1.0/24,1:2::/64
  • accept_dst_filter: log only a connection if destination ip of connection belong to specified networks. This can be a list of networks too.
  • accept_proto_filter: log only connection for the specified layer 4 protocol. It can be a list for example tcp,sctp

A GRAPHITE output module

This is the sexiest part of this release. Seth Hall from the Graphite, a scalable realtime graphing solution. I was playing at the moment with the new Netfilter accounting plugin of ulogd2 and my first thought has been that it was a good idea to add a new output ulogd2 plugin to export data to a Graphite server.

You can read more about Graphite output plugin on this dedicated post.

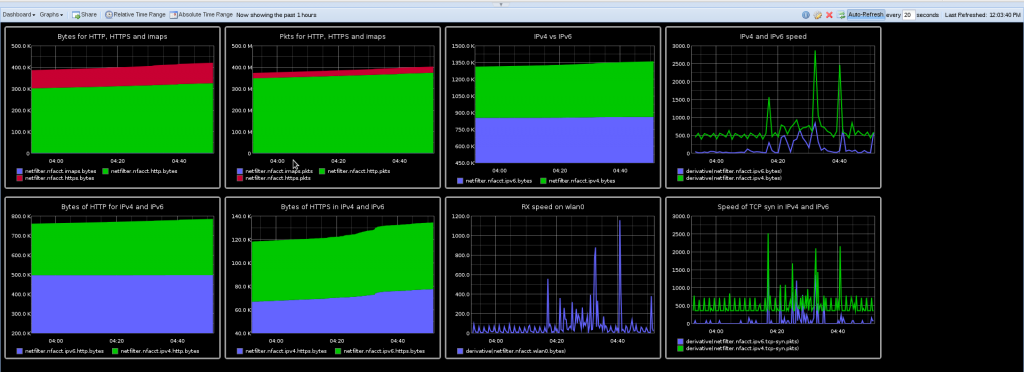
The result was really cool as show the following dashboard:

A better command line

In case of error, ulogd was just dying and telling you to read a log file. It is now possible to add the -v flag which will redirect the output to stdout and let you see what’s going one.

If it is to verbose for you, you can also set log level from command line via the -l option.

Improved build system

I’ve made some light improvement to the build system. First of all, a configuration status is printed at the end of configure. It displays the compiled input and output plugins:

Ulogd configuration:
  Input plugins:
    NFLOG plugin:			yes
    NFCT plugin:			yes
    NFACCT plugin:			yes
  Output plugins:
    PCAP plugin:			yes
    PGSQL plugin:			yes
    MySQL plugin:			yes
    SQLITE3 plugin:			no
    DBI plugin:				no

I’ve also added configure option to disable the building of some input plugins:

  --enable-nflog          Enable nflog module [default=yes]
  --enable-nfct           Enable nfct module [default=yes]
  --enable-nfacct         Enable nfacct module [default=yes]

For example, to disable Netfilter conntrack logging, you can use:

./configure --disable-nfct

.

Some statistics about Suricata 1.4

A huge work

Suricata 1.4 has been released December 13th 2012 and it has been a huge work. The number of modifications is just impressing:

390 files changed, 25299 insertions(+), 11982 deletions(-)

The following video is using gource to display the evolution of Suricata IDS/IPS source code between version 1.3 and version 1.4. It only displays the modified files and do not show the files existing at start.

A collaborative work

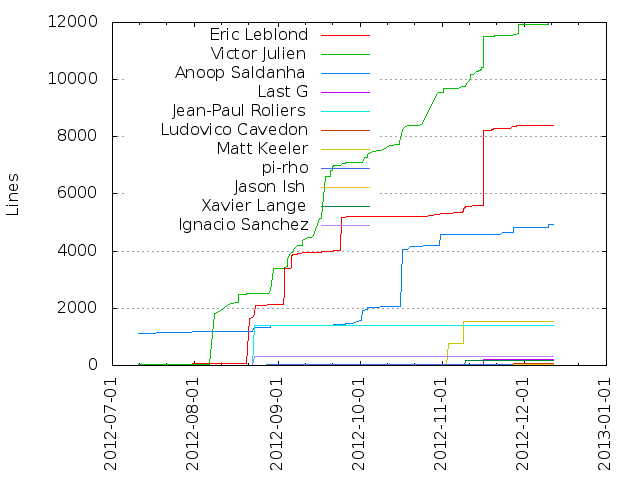
A total of 11 different authors have participated to this release. The following graph generated by gitstats shows the number of lines of code by author:

Some words about activity

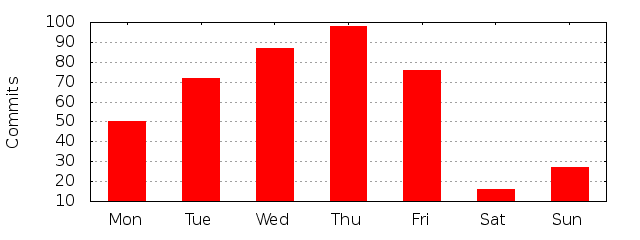
The activity shows that most of the work is done during week day but there is some work done on sunday:

As shown the following graph, the activity as decreased during the stabilization process:

0

0

0

0

0

1

0

0

6

7

9

10

5

11

11

11

15

51

15

35

23

22

16

24

10

29

32

26

18

16

6

8

32 31 30 29 28 27 26 25 24 23 22 21 20 19 18 17 16 15 14 13 12 11 10 9 8 7 6 5 4 3 2 1

The defense blues

Mother Nature has been really unfair with me. It has given me two strong interests in life: building things and information security. Once that was done, my doom was sealed and I’ve become a infosec defense guy. Nowadays this is one of the worst fate possible in computer science.

Today, this burden is really hard to wear. I know some of you will try to encourage me by saying this like:

It is not that bad. You could have been a Microsoft Exchange administrator.

And they are right. I’m doing really interesting things and taking a lot of pleasure at doing them. The point is not here. It is on the way information security community is evolving. It is cheering the offensive guys and as everybody want to be loved this lead to absurd and dangerous behaviors. And this is just becoming worse every day.

My last example is a conference given at Blackhat by Antonios Atlasis, Chief/Research at Center for strategic cyberspace + security science. The talk is advertised on CSCSS website which is a first sign of the importance of infosec circus for this kind of entity. But let’s get back to the main issue. The talk is showing some results of a study made by Mr. Atlasis on security impact of IPv6 extension headers. Among the result, successful evasion of two well-known IDS: snort and Suricata. And this completely pissed me off.

I’m one of the developer of Suricata and we never have been contacted by the guy before the event. So to sum up, a guy working for a not-for-profit organization is publishing attacks on software without even having warn the editor before. That’s just insane. And this show, the current spirit in information security:

I publish vulnerability without warning editor to maximize the impact of my talk

The worse thing is that I know that a possible defense will be:

I’m a good guy cause I could have sell it as a O-day

That’s not a real excuse. O-day sellers are just blackhats in suit. Or to be more accurate as I know some of them don’t wear suit, blackhats doing public business thanks to the legal void on the selling of cyberweapons. A guy working for a not-for-profit organization has to be a whitehat. I think this is even mandatory in the USA as it seems the not-for-profit organization must act for public good.

Yes, being a defensive guy is not fair. You build huge and complex structure and all the light (and sometime the money) is for the one who demonstrate how one of the thousand engines you’ve build can be abused. And this is the climax when the guy disrespects you by not letting you a chance to fix the issue before it goes public.

A new unix command mode in Suricata

Introduction

I’ve been working for the past few days on a new Suricata feature. It is available in Suricata 1.4rc1.

Suricata can now listen to a unix socket and accept commands from the user. The exchange protocol is JSON-based and the format of the message has been done to be generic and it is described in this commit message. An example script called suricatasc is provided in the source and installed automatically when updating Suricata.

Unix socket command

By setting enabled to yes under unix-command in Suricata YAML configuration file, the creation of the socket is now activated:

unix-command:
  enabled: yes
  #filename: custom.socket # use this to specify an alternate file

This provides for now a set of really exciting commands like:

  • shutdown: this shutdown suricata
  • iface-list: list interfaces where Suricata is sniffing packets
  • iface-stat: list statistic for an interface

For example, a typical session with suricatasc will looks like:

# suricatasc 
>>> iface-list
Success: {'count': 2, 'ifaces': ['eth0', 'eth1']}
>>> iface-stat eth0
Success: {'pkts': 378, 'drop': 0, 'invalid-checksums': 0}

Useful but not really sexy for now. But the main part is the dedicated running mode.

Unix socket running mode

This mode is one of main motivation behind this code. The idea is to be able to ask to Suricata to treat different pcap files without having to restart Suricata between the files.
This provides you a huge gain in time as you don’t need to wait for the signature engine to initialize.

To use this mode, start suricata with your preferred YAML file and provide the option –unix-socket as argument:

suricata -c /etc/suricata-full-sigs.yaml --unix-socket

Then, you can use the provided script suricatasc to connect to the command socket and ask for pcap treatment:

root@tiger:~# suricatasc
>>> pcap-file /home/benches/file1.pcap /tmp/file1
Success: Successfully added file to list
>>> pcap-file /home/benches/file2.pcap /tmp/file2
Success: Successfully added file to list

Yes, you can add multiple files without waiting the result: they will be sequentially processed and the generated log/alert files will be put into the directory specified as second arguments of the pcap-file command. You need to provide absolute path to the files and directory as suricata don’t know from where the script has been run.

To know how much files are waiting to get processed, you can do:

>>> pcap-file-number
Success: 3

To get the list of queued files, do:

>>> pcap-file-list
Success: {'count': 2, 'files': ['/home/benches/file1.pcap', '/home/benches/file2.pcap']}

suritasc script is just intended to be a basic tool to send commands. The protocol has been choozen to be simple so people can easily build their own scripts.

Some words about the protocol

The client connect to the socket and sends its protocol version:

{ "version": "$VERSION_ID" }

The server sends an answer:

{ "return": "OK|NOK" }

If server returns OK, the client is now allowed to send command.

The format of command is the following:

{
   "command": "$COMMAND_NAME",
   "arguments": { $KEY1: $VAL1, ..., $KEYN: $VALN }
}

For example, to ask suricata to treat a pcap, the command is something like:

{
  "command": "pcap-file",
  "arguments": { "filename": "smtp-clean.pcap", "output-dir": "/tmp/out" }
}

The server will try to execute the “command” specified with the
(optional) provided “arguments”.
The answer by server is the following:

{
  "return": "OK|NOK",
  "message": JSON_OBJECT or information string
}

Building it

This new features use jansson the encoding/decoding JSON and it needs thus to be installed on your system before you can do the build. On Debian (testing or sid) or Ubuntu, you can install libjansson-dev

Now, you can proceed with your normal build. For example:

./autogen.sh
./configure
make
make install

You can check if the support will be build in the message at end of configure:

Suricata Configuration:
  AF_PACKET support:                       yes
...
  Unix socket enabled:                     yes

  libnss support:                          no
  libnspr support:                         no
  libjansson support:                      yes

If this is your first install, you may want to run make install-full to get a working configuration of Suricata with Emerging Threats rules being downloaded and setup.

Now, you can just do:

suricata --unix-socket

Conclusion

This new features can be really interesting for people that are using Suricata to parse a large numbers of pcap. But the unix command may be really interesting when more commands will be available. Regarding this don’t hesitate to give me some feedbacks or ideas.

New AF_PACKET IPS mode in Suricata

A new Suricata IPS mode

Suricata IPS capabilities are not new. It is possible to use Suricata with Netfilter or ipfw to build a state-of-the-art IPS. On Linux, this system has not the best throughput performance. Patrick McHardy’s work on netlink: memory mapped I/O should bring some real improvement but this is not yet available.

I’ve thus decided to do an implementation of IPS based on AF_PACKET (read raw socket). The idea is based on one of the snort’s running mode. It peers two network interfaces and all packets received from one interface are sent to the other interface (if a signature with drop keyword does not fired on the packet). This requires to dedicate two network interfaces for Suricata but this provide a simple bridge system. As suricata is using latest AF_PACKET features (read load balancing), it was possible to build something really promising.

Victor Julien has commited my implementation which is now available in current git tree and will be part of Suricata 1.4beta1.

Configuration

You need to dedicate two network interfaces for this mode. The configuration is made via some new configuration variable available in the description of an AF_PACKET interface.

For example, the following configuration will create a Suricata acting as IPS between interface eth0 and eth1:

af-packet:
  - interface: eth0
    threads: 1
    defrag: yes
    cluster-type: cluster_flow
    cluster-id: 98
    copy-mode: ips
    copy-iface: eth1
    buffer-size: 64535
    use-mmap: yes
  - interface: eth1
    threads: 1
    cluster-id: 97
    defrag: yes
    cluster-type: cluster_flow
    copy-mode: ips
    copy-iface: eth0
    buffer-size: 64535
    use-mmap: yes

Basically, we’ve got an af-packet configuration with two interfaces. Interface eth0 will copy all received packets to eth1 because of the copy-* configuration variable:

    copy-mode: ips
    copy-iface: eth1

The configuration on eth1 is symetric:

    copy-mode: ips
    copy-iface: eth0

There is some important facts to consider when setting up this mode:

  • The implementation of this mode is dependent of the zero copy mode of AF_PACKET. Thus you need to set use-mmap to yes on both interface.
  • MTU on both interfaces have to be equal: the copy from one interface to the other is direct and packet bigger then the MTU will be dropped by kernel.
  • Set different values of cluster-id on both interfaces to avoid conflict.

The copy-mode variable can take the following values:

  • ips: the drop keyword is honored and matching packet are dropped.
  • tap: no drop occurs, Suricata act as a bridge

Please note, that mode can be different on the peered interfaces.

Current limitation

One other important point is that the threads variable must be equal on both interface. This is due to the fact the peering is done at the socket level: each packet received on a socket is sent to a peered socket listening to the peered interface.

At last but not least, you need at least Linux kernel 3.6 (or 3.4.12) to be able to set a threads value higher than 1. There is a bug in prior kernel that causes an infinite loop (packet being sent from an interface and reread, …). If you can’t wait or can’t made a full upgrade of your kernel you can use my patch which will be part of Linux 3.6 and of Linux 3.4.12.

Running it

Running Suricata in AF_PACKET IPS mode is straight forward. Once the configuration has been updated, you can simply run:

suricata -c /etc/suricata/suricata.yaml --af-packet

Please note that is possible to have normal IDS interface running simultaneously. For example, eth3 could be added to the af-packet configuration and used a regular interface.

Some implementation details

You can find some additional technical information in the commit.

As mentioned below, the peering is done at the socket level. In Suricata, each capture thread is opening a socket and is binding it to the cluster-id of the interface.
Once a thread is started, it is peered with an thread listening to the copy-iface interface which socket will be used as a send interface.
This system permit to avoid locking issue in workers running mode as only one thread will write to the peered socket at a time because we have only one packet treated by a capture thread at a time.

We need to reuse the interface for a simple reason: if a new dedicated socket was to be used, the packet sent to this socket would be received by Suricata read socket instead of being ignored. Linux kernel implement the natural feature of avoiding to send back packet to the sending socket.

This behavior was implemented in Linux kernel for regular socket but this was not the case for clustered sockets. This is why at least Linux 3.6 or my patch is needed to be able to use a value of threads bigger than one.

Conclusion

This mode is new in Suricata and is is really promising. It has suffered limited testing in high bandwidth environment. So, as usual, feedback is more than welcome. Don’t hesitate to send me a mail or to ask question on Suricata Mailing lists.

Suricata new TLS fingerprint and TLS store keywords.

Suricata TLS support

Victor Julien has just merged to main tree a branch containing some interesting new TLS related features. They have been contributed by me and Jean-Paul Roliers.

This patchset introduces TLS logging and brings some new keywords to Suricata engine.
Here’s the list of all TLS related keywords that are available in latest Suricata git:

  • tls.version: match on version of protocol
  • tls.subject: match on subject of certificate
  • tls.issuerdn: match on issuer DN of certificate
  • tls.fingerprint: match on SHA1 fingerprint of certificate
  • tls.store: store the certificate on disk

You will find detailed explanation below.

TLS handshake parser in Suricata 1.3

In Suricata 1.3, Pierre Chifflier has contributed a TLS handshake parser which allows Suricata to analyse the TLS parameters of a connection.
The first available keywords were tls.subject and tls.issuerdn. They allow the writing of rules similar to this one:

alert tls any any -> any any (msg:"forged ssl google user";
            tls.subject:"CN=*.googleusercontent.com";
            tls.issuerdn:!"CN=Google-Internet-Authority"; sid:8; rev:1;)

Here, suricata will alert if a certificate for CN=*.googleusercontent.com is not signed by CN=Google-Internet-Authority.

An other TLS related feature present in Suricata is the tls.version which allow you to match on the version of the protocol.

TLS Features included in the upcoming Suricata 1.4

TLS logging

Suricata can now log information about all TLS handshakes in a custom file. To activate this feature, you can add to your suricata.yaml file:

outputs:
  # a line based log of TLS handshake parameters (no alerts)
  - tls-log:
      enabled: yes  # Log TLS connections.
      filename: tls.log # File to store TLS logs.
      extended: yes # Log extended information like fingerprint

This will create a tls.log file that will contain information about TLS handshake:

08/27/2012-17:32:12.951518 2a01:0e35:1394:5ed0:0212:15ff:fe45:52bd:37957 -> 2001:41d0:0001:9598:0000:0000:0000:0001:443  TLS: Subject='OU=Domain Control Validated, OU=Gandi Standard SSL, CN=home.regit.org' Issuerdn='C=FR, O=GANDI SAS, CN=Gandi Standard SSL CA' SHA1='f3:40:21:48:70:2c:31:bc:b5:aa:22:ad:63:d6:bc:2e:b3:46:e2:5a' VERSION='TLS 1.2'
08/27/2012-17:45:07.812823 2a01:0e35:1394:5ed0:0212:15ff:fe45:52bd:56158 -> 2a00:1450:4007:0803:0020:0000:0400:100c:443  TLS: Subject='C=US, ST=California, L=Mountain View, O=Google Inc, CN=*.googleusercontent.com' Issuerdn='C=US, O=Google Inc, CN=Google Internet Authority' SHA1='c7:51:ea:f3:80:fa:ee:6e:3c:16:28:35:44:51:94:30:2d:76:31:9d' VERSION='TLS 1.1'
08/27/2012-17:45:13.600843 192.168.12.149:50035 -> 199.59.148.21:443  TLS: Subject='C=US, ST=CA, L=San Francisco, O=Twitter, Inc., OU=Twitter Security, CN=tdweb.twitter.com' Issuerdn='C=US, O=DigiCert Inc, OU=www.digicert.com, CN=DigiCert High Assurance CA-3' SHA1='4e:f3:3f:92:86:cf:52:6c:74:e9:fc:40:d0:d7:9d:f2:4e:e4:91:1f'VERSION='TLS 1.1' 

This can be used for statistical study and other usages.

TLS fingerprint match

The new keyword tls.fingerprint allows you to match on the fingerprint of a server certificate.

It allows you to write rules such as:

alert tls any any -> any any (msg:"Regit fingerprint"; 
         tls.subject:"CN=home.regit.org";
         tls.fingerprint:!"f3:40:21:48:70:2c:31:bc:b5:aa:22:ad:63:d6:bc:2e:b3:46:e2:5a"; sid:114; rev:1;)

Here, Suricata will alert when a certificate subject matches the one of home.regit.org but has not the correct fingerprint.

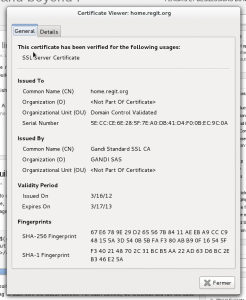
The SHA1 for a certificate can be retrieved from the tls.log file as well as from openssl or a browser.

$ openssl x509 -in cert.pem  -fingerprint
SHA1 Fingerprint=F3:40:21:48:70:2C:31:BC:B5:AA:22:AD:63:D6:BC:2E:B3:46:E2:5A

TLS store keyword

This last keyword permit to store server certificate and works in a similar way as suricata file storage. It does not take any arguments and trigger the storage of the certificate on the filesystem.
Our home.regit.org rules can be improved to store the certificate by simply adding tls.store to it.

alert tls any any -> any any (msg:"Regit fingerprint"; 
         tls.subject:"OU=Domain Control Validated, OU=Gandi Standard SSL, CN=home.regit.org";
         tls.fingerprint:!"f3:40:21:48:70:2c:31:bc:b5:aa:22:ad:63:d6:bc:2e:b3:46:e2:5a";
         tls.store; sid:114; rev:1;)

Each certificate chain is stored in a separate PEM file and a meta file is a generated too. For example, a simple mach will create the following files:

  • 1346085544.64714-1.pem
  • 1346085544.64714-1.meta

The content of the meta file similar to this:

TIME:              08/27/2012-18:39:04.064714
SRC IP:            2a01:0e35:1394:5ed0:c147:93c6:8654:70fd
DST IP:            2001:41d0:0001:9598:0000:0000:0000:0001
PROTO:             6
SRC PORT:          53494
DST PORT:          443
TLS SUBJECT:       OU=Domain Control Validated, OU=Gandi Standard SSL, CN=home.regit.org
TLS ISSUERDN:      C=FR, O=GANDI SAS, CN=Gandi Standard SSL CA
TLS FINGERPRINT:   f3:40:21:48:70:2c:31:bc:b5:aa:22:ad:63:d6:bc:2e:b3:46:e2:5a

The whole certificates chain is stored in the PEM file:

-----BEGIN CERTIFICATE-----
MIIE2DCCA8CgAwIBAgIQXszObihffqDbQdTwC+ycCjANBgkqhkiG9w0BAQUFADBB
...
3WCiQrY7P56JbvG4jNJ5H4ERj90hQquHj/8Ej39db/MCCmNgjRLVLdVkW4l5DRCe
XX2Ac2xzZtLpVmft7sE3mQauGjW9tgCtpB/fxQqiA+uq+vm1PE37ukscByM=
-----END CERTIFICATE-----
-----BEGIN CERTIFICATE-----
MIIEozCCA4ugAwIBAgIQWrYdrB5NogYUx1U9Pamy3DANBgkqhkiG9w0BAQUFADCB
...
8/ifBlIK3se2e4/hEfcEejX/arxbx1BJCHBvlEPNnsdw8dvQbdqP
-----END CERTIFICATE-----

This allow you to get all needed information during analysis.

Have fun

All theses features are available for testing in the latest Suricata git. All feedbacks are welcome.

Flow accounting with Netfilter and ulogd2

Introduction

Starting with Linux kernel 3.3, there’s a new module called nfnetlink_acct.
This new feature added by Pablo Neira brings interesting accountig capabilities to Netfilter.
Pablo has made an extensive description of the feature in the commit.

System setup

We need to build a set of tools to get all that’s necessary:

  • libmnl
  • libnetfilter_acct
  • nfacct

The build is the same for all projects:

git clone git://git.netfilter.org/PROJECT
cd PROJECT
autoreconf -i
./configure
make
sudo make install

nfacct

This command line tool is here to set up and interact with the accounting subsystem. To get the help you can use the man page or run:

# nfacct help
nfacct v1.0.0: utility for the Netfilter extended accounting infrastructure
Usage: nfacct command [parameters]...

Commands:
  list [reset]		List the accounting object table (and reset)
  add object-name	Add new accounting object to table
  delete object-name	Delete existing accounting object
  get object-name	Get existing accounting object
  flush			Flush accounting object table
  version		Display version and disclaimer
  help			Display this help message

Configuration

Objectives

Let’s have for objectives to get the following statistics:

  • IPv6 data usage
    • http on IPv6 usage
    • https on IPv6 usage
  • IPv4 data usage
    • http on IPv4 usage
    • https on IPv4 usage

Ulogd2 configuration

Let’s start by a simple output to XML. For that we will add the following stack:

stack=acct1:NFACCT,xml1:XML

and this one:

stack=acct1:NFACCT,gp1:GPRINT

nfacct setup

modprobe nfnetlink_acct
nfacct add ipv6
nfacct add http-ipv6
nfacct add https-ipv6
nfacct add ipv4
nfacct add http-ipv4
nfacct add https-ipv4

iptables setup

iptables -I INPUT -m nfacct --nfacct-name ipv4
iptables -I INPUT -p tcp --sport 80 -m nfacct --nfacct-name http-ipv4
iptables -I INPUT -p tcp --sport 443 -m nfacct --nfacct-name https-ipv4
iptables -I OUTPUT -m nfacct --nfacct-name ipv4
iptables -I OUTPUT -p tcp --dport 80 -m nfacct --nfacct-name http-ipv4
iptables -I OUTPUT -p tcp --dport 443 -m nfacct --nfacct-name https-ipv4

ip6tables setup

ip6tables -I INPUT -m nfacct --nfacct-name ipv6
ip6tables -I INPUT -p tcp --sport 80 -m nfacct --nfacct-name http-ipv6
ip6tables -I INPUT -p tcp --sport 443 -m nfacct --nfacct-name https-ipv6
ip6tables -I OUTPUT -m nfacct --nfacct-name ipv6
ip6tables -I OUTPUT -p tcp --dport 80 -m nfacct --nfacct-name http-ipv6
ip6tables -I OUTPUT -p tcp --dport 443 -m nfacct --nfacct-name https-ipv6

Starting the beast

Now we can start ulogd2:

ulogd2 -c /etc/ulogd.conf

In /var/log, we will have the following files:

  • ulogd_gprint.log: display stats for each counter on one line
  • ulogd-sum-14072012-224313.xml: XML dump
  • ulogd.log: the daemon log file to look at in case of problem

Output examples

In the ulogd_gprint.log file, the ouput for a given timestamp is something like that:

timestamp=2012/07/14-22:48:17,sum.name=http-ipv6,sum.pkts=0,sum.bytes=0
timestamp=2012/07/14-22:48:17,sum.name=https-ipv6,sum.pkts=0,sum.bytes=0
timestamp=2012/07/14-22:48:17,sum.name=ipv4,sum.pkts=20563,sum.bytes=70
timestamp=2012/07/14-22:48:17,sum.name=http-ipv4,sum.pkts=0,sum.bytes=0
timestamp=2012/07/14-22:48:17,sum.name=https-ipv4,sum.pkts=16683,sum.bytes=44
timestamp=2012/07/14-22:48:17,sum.name=ipv6,sum.pkts=0,sum.bytes=0

The XML output is the following:

<obj><name>http-ipv6</name><pkts>00000000000000000000</pkts><bytes>00000000000000000000</bytes><hour>22</hour><min>43</min><sec>15</sec><wday>7</wday><day>14</day><month>7</month><year>2012</year></obj>
<obj><name>https-ipv6</name><pkts>00000000000000000000</pkts><bytes>00000000000000000000</bytes><hour>22</hour><min>43</min><sec>15</sec><wday>7</wday><day>14</day><month>7</month><year>2012</year></obj>
<obj><name>ipv4</name><pkts>00000000000000000052</pkts><bytes>00000000000000006291</bytes><hour>22</hour><min>43</min><sec>15</sec><wday>7</wday><day>14</day><month>7</month><year>2012</year></obj>
<obj><name>http-ipv4</name><pkts>00000000000000000009</pkts><bytes>00000000000000000408</bytes><hour>22</hour><min>43</min><sec>15</sec><wday>7</wday><day>14</day><month>7</month><year>2012</year></obj>
<obj><name>https-ipv4</name><pkts>00000000000000000031</pkts><bytes>00000000000000004041</bytes><hour>22</hour><min>43</min><sec>15</sec><wday>7</wday><day>14</day><month>7</month><year>2012</year></obj>
<obj><name>ipv6</name><pkts>00000000000000000002</pkts><bytes>00000000000000000254</bytes><hour>22</hour><min>43</min><sec>15</sec><wday>7</wday><day>14</day><month>7</month><year>2012</year></obj>

Conclusion

nfacct and ulogd2 offers a easy and efficient way to gather network statistics. Some tools and glue are currently lacking to fill the data inside reporting tool but the log structure is clean and it should not be too difficult.