Defend your network from Microsoft Word upload with Suricata and Netfilter

Introduction

Some times ago, I’ve blogged about new IPS features in Suricata 1.1 and did not find at the time
any killer application of the nfq_set_mark keyword. When using Suricata in Netfilter IPS mode, this keyword allows you to set the Netfilter mark on the packet when a rule match.
This mark can be used by Netfilter or by other network subsystem to differentiate the treatment to apply to the packet.

It takes some time but I’ve found the idea. People around me know I don’t like Microsoft Office. One of the main reason, is that this is as awful as LibreOffice or OpenOffice.org but, on top of that, you’ve got pay for it. And, even if I don’t consider that people sending MS-Word file on the network should pay for that, I think they should at least benefit from a really slow bandwidth. I thus decided to implement this with Suricata and Netfilter.

If I’ve already told you that we will use the nfq_set_mark to mark the packet, one big task remains: how can I detect when someone upload a MS-Word file ? The answer is in the file extraction capabilities of Suricata. My preferred IDS/IPS is able to inspect HTTP traffic and to extract files that are uploaded or downloaded. You can then access to information about them. One of the new keyword is filemagic which return the same output as if you had run the unix file command on the file.

The setup

Now everything is in place. We just need to:

  • Write a signatures to mark packet relative to upload
  • Set up Suricata as IPS
  • Set up Netfilter to send all HTTP traffic to Suricata

The signature is really simple. We want HTTP traffic and a transferred file which is of type “Composite Document File V2 Document”. When this is the case, we alert and set the mark to 1:

alert http any any -> any any (msg:"Microsoft Word upload"; \
          nfq_set_mark:0x1/0x1; \
          filemagic:"Composite Document File V2 Document"; \
          sid:666 ; rev:1;)

Let suppose we’ve saved this signature into word.rules. Now we can start suricata with:

suricata -q 0 -S word.rules

This is cool, we now have a single packet that will be marked. But, as we want to slow down all the connection, we need to propagate the mark. We call Netfilter to the rescue and our friend here is CONNMARK that will transfer the mark to all packets:

iptables -A PREROUTING -t mangle -j CONNMARK --restore-mark
iptables -A POSTROUTING -t mangle -j CONNMARK --save-mark

If we are masochistic enough to try to slow yourself down, we need to add the following line to take care of OUTPUT packets:

iptables -A OUTPUT -t mangle -j CONNMARK --restore-mark

Now that the marking is done, let’s suppose that eth0 is the interface to Internet. In that case, we can setup the Quality of Service.
We create a HTB disc and create a 1kbps class for our MS-Word uploader:

tc qdisc add dev eth0 root handle 1: htb default 0
tc class add dev eth0 parent 1: classid 1:1 htb rate 1kbps ceil 1kbps

Now, we can do the link with our packet marking by assigning packet of handle 1 fw to the 1kpbs class (flowid 1:1):

tc filter add dev eth0 parent 1: protocol ip prio 1 handle 1 fw flowid 1:1

The job is almost done, last step is to send the port 80 packet to suricata:

iptables -I FORWARD -p tcp –dport 80 -j NFQUEUE
iptables -I FORWARD -p tcp –sport 80 -j NFQUEUE

If we are sadistic, we can also treat the local traffic:

iptables -I OUTPUT -p tcp –dport 80 -j NFQUEUE
iptables -I INPUT -p tcp –sport 80 -j NFQUEUE

That’s all with that setup, all MS-Word uploader share a 1kbps bandwith.

Effort should pay

Even among the MS-Word users, there is some people with brain and they will try to escape the MS-Word curse by changing the extension of their document before uploading them. Effort must pay, so
we will change the setup to provide the 10kbps for uploading. To do so, we add a signature to word.rules that will detect when a MS-Word file is uploaded with a changed extension:

alert http any any -> any any (msg:"Tricky Microsoft Word upload";
                nfq_set_mark:0x2/0x2; \
                fileext:!"doc"; \
                filemagic:"Composite Document File V2 Document";
                filestore;
                sid:667; rev:1;)

End of the task will be to send packet with mark 2 on a privileged pipe:

tc class add dev eth0 parent 1: classid 1:2 htb rate 10kbps ceil 10kbps
tc filter add dev eth0 parent 1: protocol ip prio 1 handle 2 fw flowid 1:2

I’m sure a lot of you think we have been to kind and that the little cheaters must be watch over. We’ve already used the filestore keyword in their signature to put the uploaded file on disk but that is not enough.

Keep an eye on cheaters

The traffic of the cheater must be watch over. To do so, we will send all the packets they exchange inside a pcap file. We will need multiple tools to do so. The first of them will be ipset that we will use to maintain a list of bad guys. And we will use ulogd to store their traffic into a pcap file.

To create the blacklist, we will just do:

ipset create cheaters hash:ip timeout 3600
iptables -A POSTROUTING -t mangle -m mark \
    --mark 0x2/0x2 \
    -j SET --add-set cheaters src --exists

The first line creates a set named cheaters that will contains IP. Every element of the set will stay for 1 hour in the set. The second line send all source IP that send packet which got the mark 2. If the IP is already in the set, it will see its timeout reset to 3600 thanks to the –exists option.

Now we will ask Nefilter to log all traffic of IP of the cheaters set:

iptables -A PREROUTING -t raw \
    -m set --match-set cheaters src,dst \
    -j NFLOG --nflog-group 1

The last step is to use ulogd to store the traffic in a pcap file. We need to modify a standard ulogd.conf to have the following lines not commented:

plugin="/home/eric/builds/ulogd/lib/ulogd/ulogd_output_PCAP.so"
stack=log2:NFLOG,base1:BASE,pcap1:PCAP

Now, we can start ulogd:

ulogd -c ulogd.conf

A PCAP file named /var/log/ulogd.pcap will be created and will contain all the packets of cheaters.

Conclusion

It has been hard. We’ve fight a lot. We’ve coded a lot. But now, they are done! We’re able to know more about them than a Facebook admin does!
A new unix command mode in Suricata

Introduction

I’ve been working for the past few days on a new Suricata feature. It is available in Suricata 1.4rc1.

Suricata can now listen to a unix socket and accept commands from the user. The exchange protocol is JSON-based and the format of the message has been done to be generic and it is described in this commit message. An example script called suricatasc is provided in the source and installed automatically when updating Suricata.

Unix socket command

By setting enabled to yes under unix-command in Suricata YAML configuration file, the creation of the socket is now activated:

unix-command:
  enabled: yes
  #filename: custom.socket # use this to specify an alternate file

This provides for now a set of really exciting commands like:

  • shutdown: this shutdown suricata
  • iface-list: list interfaces where Suricata is sniffing packets
  • iface-stat: list statistic for an interface

For example, a typical session with suricatasc will looks like:

# suricatasc 
>>> iface-list
Success: {'count': 2, 'ifaces': ['eth0', 'eth1']}
>>> iface-stat eth0
Success: {'pkts': 378, 'drop': 0, 'invalid-checksums': 0}

Useful but not really sexy for now. But the main part is the dedicated running mode.

Unix socket running mode

This mode is one of main motivation behind this code. The idea is to be able to ask to Suricata to treat different pcap files without having to restart Suricata between the files.
This provides you a huge gain in time as you don’t need to wait for the signature engine to initialize.

To use this mode, start suricata with your preferred YAML file and provide the option –unix-socket as argument:

suricata -c /etc/suricata-full-sigs.yaml --unix-socket

Then, you can use the provided script suricatasc to connect to the command socket and ask for pcap treatment:

root@tiger:~# suricatasc
>>> pcap-file /home/benches/file1.pcap /tmp/file1
Success: Successfully added file to list
>>> pcap-file /home/benches/file2.pcap /tmp/file2
Success: Successfully added file to list

Yes, you can add multiple files without waiting the result: they will be sequentially processed and the generated log/alert files will be put into the directory specified as second arguments of the pcap-file command. You need to provide absolute path to the files and directory as suricata don’t know from where the script has been run.

To know how much files are waiting to get processed, you can do:

>>> pcap-file-number
Success: 3

To get the list of queued files, do:

>>> pcap-file-list
Success: {'count': 2, 'files': ['/home/benches/file1.pcap', '/home/benches/file2.pcap']}

suritasc script is just intended to be a basic tool to send commands. The protocol has been choozen to be simple so people can easily build their own scripts.

Some words about the protocol

The client connect to the socket and sends its protocol version:

{ "version": "$VERSION_ID" }

The server sends an answer:

{ "return": "OK|NOK" }

If server returns OK, the client is now allowed to send command.

The format of command is the following:

{
   "command": "$COMMAND_NAME",
   "arguments": { $KEY1: $VAL1, ..., $KEYN: $VALN }
}

For example, to ask suricata to treat a pcap, the command is something like:

{
  "command": "pcap-file",
  "arguments": { "filename": "smtp-clean.pcap", "output-dir": "/tmp/out" }
}

The server will try to execute the “command” specified with the
(optional) provided “arguments”.
The answer by server is the following:

{
  "return": "OK|NOK",
  "message": JSON_OBJECT or information string
}

Building it

This new features use jansson the encoding/decoding JSON and it needs thus to be installed on your system before you can do the build. On Debian (testing or sid) or Ubuntu, you can install libjansson-dev

Now, you can proceed with your normal build. For example:

./autogen.sh
./configure
make
make install

You can check if the support will be build in the message at end of configure:

Suricata Configuration:
  AF_PACKET support:                       yes
...
  Unix socket enabled:                     yes

  libnss support:                          no
  libnspr support:                         no
  libjansson support:                      yes

If this is your first install, you may want to run make install-full to get a working configuration of Suricata with Emerging Threats rules being downloaded and setup.

Now, you can just do:

suricata --unix-socket

Conclusion

This new features can be really interesting for people that are using Suricata to parse a large numbers of pcap. But the unix command may be really interesting when more commands will be available. Regarding this don’t hesitate to give me some feedbacks or ideas.

Coccigrep improved func operation

Coccigrep 1.11 is now available and mainly features some improvements related to the func search. The func operation can be used to search when a structure is used as argument of a function. For example, to search where the Packet structures are freed inside Suricata project, one can run:

$ coccigrep -t Packet -a "SCFree" -o func src/
src/alert-unified2-alert.c:1156 (Packet *p):         SCFree(p);
src/alert-unified2-alert.c:1161 (Packet *p):         SCFree(p);
...
src/alert-unified2-alert.c:1368 (Packet *pkt):         SCFree(pkt);

With coccigrep 1.11, it is now possible to look for a function with a regular expression. For example, to see how a time_t is used in the print function of Suricata which are all starting by SCLog (SCLogDebug, SCLogWarning, …), you can simply run:

$ coccigrep -t time_t -a "SCLog.*" -o func src/ 
src/defrag.c:480 (time_t *dc->timeout):     SCLogDebug("\tTimeout: %"PRIuMAX, (uintmax_t)dc->timeout);

With 1.11 version, the func operation is now more useful. It is also more accurate as casted parameters or direct use of a structure (instead of usage though a pointer) are now supported.

New AF_PACKET IPS mode in Suricata

A new Suricata IPS mode

Suricata IPS capabilities are not new. It is possible to use Suricata with Netfilter or ipfw to build a state-of-the-art IPS. On Linux, this system has not the best throughput performance. Patrick McHardy’s work on netlink: memory mapped I/O should bring some real improvement but this is not yet available.

I’ve thus decided to do an implementation of IPS based on AF_PACKET (read raw socket). The idea is based on one of the snort’s running mode. It peers two network interfaces and all packets received from one interface are sent to the other interface (if a signature with drop keyword does not fired on the packet). This requires to dedicate two network interfaces for Suricata but this provide a simple bridge system. As suricata is using latest AF_PACKET features (read load balancing), it was possible to build something really promising.

Victor Julien has commited my implementation which is now available in current git tree and will be part of Suricata 1.4beta1.

Configuration

You need to dedicate two network interfaces for this mode. The configuration is made via some new configuration variable available in the description of an AF_PACKET interface.

For example, the following configuration will create a Suricata acting as IPS between interface eth0 and eth1:

af-packet:
  - interface: eth0
    threads: 1
    defrag: yes
    cluster-type: cluster_flow
    cluster-id: 98
    copy-mode: ips
    copy-iface: eth1
    buffer-size: 64535
    use-mmap: yes
  - interface: eth1
    threads: 1
    cluster-id: 97
    defrag: yes
    cluster-type: cluster_flow
    copy-mode: ips
    copy-iface: eth0
    buffer-size: 64535
    use-mmap: yes

Basically, we’ve got an af-packet configuration with two interfaces. Interface eth0 will copy all received packets to eth1 because of the copy-* configuration variable:

    copy-mode: ips
    copy-iface: eth1

The configuration on eth1 is symetric:

    copy-mode: ips
    copy-iface: eth0

There is some important facts to consider when setting up this mode:

  • The implementation of this mode is dependent of the zero copy mode of AF_PACKET. Thus you need to set use-mmap to yes on both interface.
  • MTU on both interfaces have to be equal: the copy from one interface to the other is direct and packet bigger then the MTU will be dropped by kernel.
  • Set different values of cluster-id on both interfaces to avoid conflict.

The copy-mode variable can take the following values:

  • ips: the drop keyword is honored and matching packet are dropped.
  • tap: no drop occurs, Suricata act as a bridge

Please note, that mode can be different on the peered interfaces.

Current limitation

One other important point is that the threads variable must be equal on both interface. This is due to the fact the peering is done at the socket level: each packet received on a socket is sent to a peered socket listening to the peered interface.

At last but not least, you need at least Linux kernel 3.6 (or 3.4.12) to be able to set a threads value higher than 1. There is a bug in prior kernel that causes an infinite loop (packet being sent from an interface and reread, …). If you can’t wait or can’t made a full upgrade of your kernel you can use my patch which will be part of Linux 3.6 and of Linux 3.4.12.

Running it

Running Suricata in AF_PACKET IPS mode is straight forward. Once the configuration has been updated, you can simply run:

suricata -c /etc/suricata/suricata.yaml --af-packet

Please note that is possible to have normal IDS interface running simultaneously. For example, eth3 could be added to the af-packet configuration and used a regular interface.

Some implementation details

You can find some additional technical information in the commit.

As mentioned below, the peering is done at the socket level. In Suricata, each capture thread is opening a socket and is binding it to the cluster-id of the interface.
Once a thread is started, it is peered with an thread listening to the copy-iface interface which socket will be used as a send interface.
This system permit to avoid locking issue in workers running mode as only one thread will write to the peered socket at a time because we have only one packet treated by a capture thread at a time.

We need to reuse the interface for a simple reason: if a new dedicated socket was to be used, the packet sent to this socket would be received by Suricata read socket instead of being ignored. Linux kernel implement the natural feature of avoiding to send back packet to the sending socket.

This behavior was implemented in Linux kernel for regular socket but this was not the case for clustered sockets. This is why at least Linux 3.6 or my patch is needed to be able to use a value of threads bigger than one.

Conclusion

This mode is new in Suricata and is is really promising. It has suffered limited testing in high bandwidth environment. So, as usual, feedback is more than welcome. Don’t hesitate to send me a mail or to ask question on Suricata Mailing lists.

Suricata new TLS fingerprint and TLS store keywords.

Suricata TLS support

Victor Julien has just merged to main tree a branch containing some interesting new TLS related features. They have been contributed by me and Jean-Paul Roliers.

This patchset introduces TLS logging and brings some new keywords to Suricata engine.
Here’s the list of all TLS related keywords that are available in latest Suricata git:

  • tls.version: match on version of protocol
  • tls.subject: match on subject of certificate
  • tls.issuerdn: match on issuer DN of certificate
  • tls.fingerprint: match on SHA1 fingerprint of certificate
  • tls.store: store the certificate on disk

You will find detailed explanation below.

TLS handshake parser in Suricata 1.3

In Suricata 1.3, Pierre Chifflier has contributed a TLS handshake parser which allows Suricata to analyse the TLS parameters of a connection.
The first available keywords were tls.subject and tls.issuerdn. They allow the writing of rules similar to this one:

alert tls any any -> any any (msg:"forged ssl google user";
            tls.subject:"CN=*.googleusercontent.com";
            tls.issuerdn:!"CN=Google-Internet-Authority"; sid:8; rev:1;)

Here, suricata will alert if a certificate for CN=*.googleusercontent.com is not signed by CN=Google-Internet-Authority.

An other TLS related feature present in Suricata is the tls.version which allow you to match on the version of the protocol.

TLS Features included in the upcoming Suricata 1.4

TLS logging

Suricata can now log information about all TLS handshakes in a custom file. To activate this feature, you can add to your suricata.yaml file:

outputs:
  # a line based log of TLS handshake parameters (no alerts)
  - tls-log:
      enabled: yes  # Log TLS connections.
      filename: tls.log # File to store TLS logs.
      extended: yes # Log extended information like fingerprint

This will create a tls.log file that will contain information about TLS handshake:

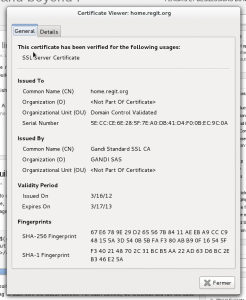
08/27/2012-17:32:12.951518 2a01:0e35:1394:5ed0:0212:15ff:fe45:52bd:37957 -> 2001:41d0:0001:9598:0000:0000:0000:0001:443  TLS: Subject='OU=Domain Control Validated, OU=Gandi Standard SSL, CN=home.regit.org' Issuerdn='C=FR, O=GANDI SAS, CN=Gandi Standard SSL CA' SHA1='f3:40:21:48:70:2c:31:bc:b5:aa:22:ad:63:d6:bc:2e:b3:46:e2:5a' VERSION='TLS 1.2'
08/27/2012-17:45:07.812823 2a01:0e35:1394:5ed0:0212:15ff:fe45:52bd:56158 -> 2a00:1450:4007:0803:0020:0000:0400:100c:443  TLS: Subject='C=US, ST=California, L=Mountain View, O=Google Inc, CN=*.googleusercontent.com' Issuerdn='C=US, O=Google Inc, CN=Google Internet Authority' SHA1='c7:51:ea:f3:80:fa:ee:6e:3c:16:28:35:44:51:94:30:2d:76:31:9d' VERSION='TLS 1.1'
08/27/2012-17:45:13.600843 192.168.12.149:50035 -> 199.59.148.21:443  TLS: Subject='C=US, ST=CA, L=San Francisco, O=Twitter, Inc., OU=Twitter Security, CN=tdweb.twitter.com' Issuerdn='C=US, O=DigiCert Inc, OU=www.digicert.com, CN=DigiCert High Assurance CA-3' SHA1='4e:f3:3f:92:86:cf:52:6c:74:e9:fc:40:d0:d7:9d:f2:4e:e4:91:1f'VERSION='TLS 1.1' 

This can be used for statistical study and other usages.

TLS fingerprint match

The new keyword tls.fingerprint allows you to match on the fingerprint of a server certificate.

It allows you to write rules such as:

alert tls any any -> any any (msg:"Regit fingerprint"; 
         tls.subject:"CN=home.regit.org";
         tls.fingerprint:!"f3:40:21:48:70:2c:31:bc:b5:aa:22:ad:63:d6:bc:2e:b3:46:e2:5a"; sid:114; rev:1;)

Here, Suricata will alert when a certificate subject matches the one of home.regit.org but has not the correct fingerprint.

The SHA1 for a certificate can be retrieved from the tls.log file as well as from openssl or a browser.

$ openssl x509 -in cert.pem  -fingerprint
SHA1 Fingerprint=F3:40:21:48:70:2C:31:BC:B5:AA:22:AD:63:D6:BC:2E:B3:46:E2:5A

TLS store keyword

This last keyword permit to store server certificate and works in a similar way as suricata file storage. It does not take any arguments and trigger the storage of the certificate on the filesystem.
Our home.regit.org rules can be improved to store the certificate by simply adding tls.store to it.

alert tls any any -> any any (msg:"Regit fingerprint"; 
         tls.subject:"OU=Domain Control Validated, OU=Gandi Standard SSL, CN=home.regit.org";
         tls.fingerprint:!"f3:40:21:48:70:2c:31:bc:b5:aa:22:ad:63:d6:bc:2e:b3:46:e2:5a";
         tls.store; sid:114; rev:1;)

Each certificate chain is stored in a separate PEM file and a meta file is a generated too. For example, a simple mach will create the following files:

  • 1346085544.64714-1.pem
  • 1346085544.64714-1.meta

The content of the meta file similar to this:

TIME:              08/27/2012-18:39:04.064714
SRC IP:            2a01:0e35:1394:5ed0:c147:93c6:8654:70fd
DST IP:            2001:41d0:0001:9598:0000:0000:0000:0001
PROTO:             6
SRC PORT:          53494
DST PORT:          443
TLS SUBJECT:       OU=Domain Control Validated, OU=Gandi Standard SSL, CN=home.regit.org
TLS ISSUERDN:      C=FR, O=GANDI SAS, CN=Gandi Standard SSL CA
TLS FINGERPRINT:   f3:40:21:48:70:2c:31:bc:b5:aa:22:ad:63:d6:bc:2e:b3:46:e2:5a

The whole certificates chain is stored in the PEM file:

-----BEGIN CERTIFICATE-----
MIIE2DCCA8CgAwIBAgIQXszObihffqDbQdTwC+ycCjANBgkqhkiG9w0BAQUFADBB
...
3WCiQrY7P56JbvG4jNJ5H4ERj90hQquHj/8Ej39db/MCCmNgjRLVLdVkW4l5DRCe
XX2Ac2xzZtLpVmft7sE3mQauGjW9tgCtpB/fxQqiA+uq+vm1PE37ukscByM=
-----END CERTIFICATE-----
-----BEGIN CERTIFICATE-----
MIIEozCCA4ugAwIBAgIQWrYdrB5NogYUx1U9Pamy3DANBgkqhkiG9w0BAQUFADCB
...
8/ifBlIK3se2e4/hEfcEejX/arxbx1BJCHBvlEPNnsdw8dvQbdqP
-----END CERTIFICATE-----

This allow you to get all needed information during analysis.

Have fun

All theses features are available for testing in the latest Suricata git. All feedbacks are welcome.

Minimal linux kernel config for Virtualbox

I was looking for some minimal Linux kernel configuration for Virtualbox guest and did only find some old one. I thus decide to build one and to publish them.
They are available on github: regit-config

For now, the only published configuration are for Linux kernel 3.5:

Run a build on all commits in a git branch

Sometime, you need to check that all the commits in a branch are building correctly. For example, when a rebase has been done, it is possible you or diff has made a mistake during the operation. The building operation can be run against all commits of the current branch with the following one-liner (splitted here for more readability):

for COMMIT in $(git log --reverse --format=format:%H origin/master..HEAD); do
    git checkout ${COMMIT} ;
    make -j8 1>/dev/null || { echo "Commit $COMMIT don't build";  break; }
done

The idea is trivial, we build the list of commits with git log using a simple format string (to get only the hash). We add the reverse tag to start from the oldest commit.
For each commit, we checkout and run the build command. If the build fails, we exit from the loop.

The result is a directory with the non-building code. Thus, don’t forget to get back to the original branch ORIG_BRANCH by running a git checkout ORIG_BRANCH.

Set or unset define variables in Coccigrep

Following a discussion with the great Julia Lawall, she added a new feature in coccinelle: it is now possible to define as set or unset some variables. This option has been added in coccigrep 1.9 and requires coccinelle 1.0-rc14.

For example, let’s have a code like Suricata where a lot of unit tests are implemented. The structure of the code is the following:

REGULAR CODE

#ifdef UNITTESTS
 TEST CODE
#endif

When doing search in the regular code, you don’t want to be bothered by results found in the test code. To obtain this result, you can pass the -U UNITTESTS option to coccigrep to tell him to consider UNITTESTS variable as undefined. If you want to define a variable, you can use the -D flag.

If you are using coccigrep inside vim, you can set the coccigrep_path variable with this option. The basic vim syntax is:

let g:coccigrep_path="coccigrep -U UNITTESTS"

As I wanted to have it for all query in my Suricata source directory, I’ve added at the end of my ~/.vim/after/syntax/suricata.vim file:

autocmd BufEnter,BufNewFile,BufRead */git/oisf/* let g:coccigrep_path="coccigrep -U UNITTESTS"

Suricata, to 10Gbps and beyond

Introduction

Since the beginning of July 2012, OISF team is able to access to a server where one interface is receiving
some mirrored real European traffic. When reading "some", think between 5Gbps and 9.5Gbps
constant traffic. With that traffic, this is around 1Mpps to 1.5M packet per seconds we have to study.

The box itself is a standard server with the following characteristics:

  • CPU: One Intel(R) Xeon(R) CPU E5-2680 0 @ 2.70GHz (16 cores counting Hyperthreading)
  • Memory: 32Go
  • capture NIC: Intel 82599EB 10-Gigabit SFI/SFP+

The objective is simple: be able to run Suricata on this box and treat the whole
traffic with a decent number of rules. With the constraint not to use any non
official system code (plain system and kernel if we omit a driver).

The code on the box have been updated October 4th:

  • It runs Suricata 1.4beta2
  • with 6719 signatures
  • and 0% packet loss
  • with setup described below

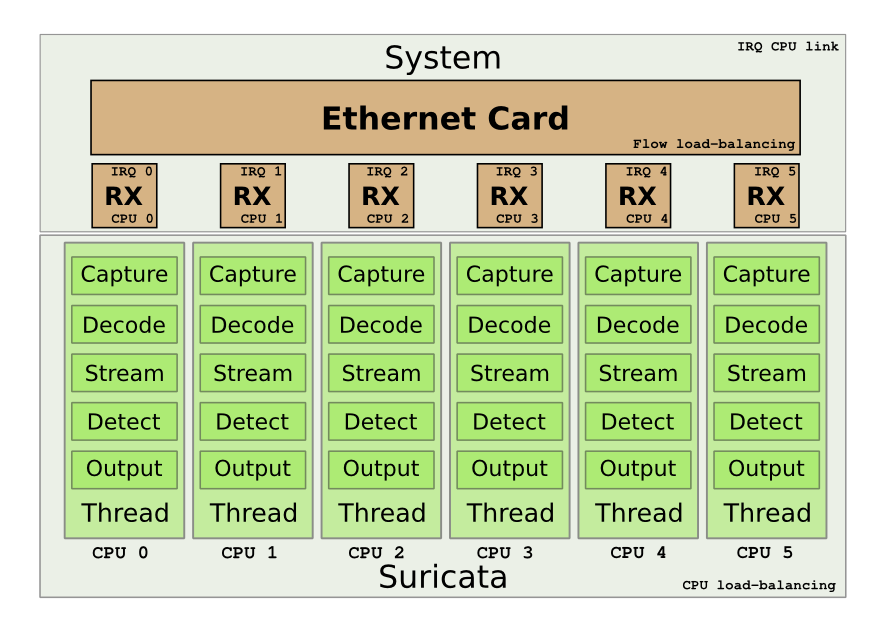
The setup is explained by the following schema:

We want to use the multiqueue system on the Intel card to be able to load balance the treatment. Next goal is to have one single CPU to treat the packet from the start to the end.

Peter Manev, Matt Jonkmann, Anoop Saldanha and Eric Leblond (myself) have been involved in
the here described setup.

Detailed method

The Intel NIC benefits from a multiqueue system. The RX/TX traffic can be load-balanced
on different interrupts. In our case, this permit to handle a part of the flow on each
CPU. One really interesting thing is that the load-balancing can be done with respect
to the IP flows. By default, one RX queue is created per-CPU.

More information about multiqueue ethernet devices can be found in the document
networking/scaling.txt in the Documentation directory of Linux sources.

Suricata is able to do zero-copy in AF_PACKET capture mode. One other interesting feature
of this mode is that you can have multiple threads listening to the same interface. In
our case, we can start one threads per queue to have a load-balancing of capture on all
our resources.

Suricata has different running modes which define how the different parts of the engine
(decoding, streaming, siganture, output) are chained. One of the mode is the ‘workers’
mode where all the treatment for a packet is made on a single thread. This mode is
adapted to our setup as it will permit to keep the work from start to end on a single
thread. By using the CPU affinity system available in Suricata, we can assign each
thread to a single CPU. By doing this the treatment of each packet can be done on
a single CPU.

But this does not solve one problem which is the link between the CPU receiving the packet
and the one used in Suricata.
To do so we have to ensure that when a packet is received on a queue, the CPU that will
handle the packet will be the same as the one treating the packet in Suricata. David
Miller had already planned this kind of setup when coding the fanout mode of AF_PACKET.
One of the flow load balancing mode is flow_cpu. In this mode, the packet is delivered to
the same track depending on the CPU.

The dispatch is made by using the formula "cpu % num" where cpu is the cpu number and
num is the number of socket bound to the same fanout socket. By the way, this imply
you can’t have a number of sockets superior to the number of CPUs.
A code study shows that the assignement in the array of sockets is incrementally made.
Thus first socket to bind will be assigned to the first CPU, etc..
In case, a socket disconnect from the set, the last socket of the array will take the empty place.
This implies the optimizations will be partially lost in case of a disconnect.

By using the flow_cpu dispatch of AF_PACKET and the workers mode of Suricata, we can
manage to keep all work on the same CPU.

Preparing the system

The operating system running on is an Ubuntu 12.04 and the driver igxbe
was outdated.
Using the instruction available on Intel website (README.txt),
we’ve updated the driver.
Next step was to unload the old driver and load the new one

sudo rmmod ixgbe
sudo modprobe ixgbe FdirPballoc=3

Doing this we’ve also tried to use the RSS variable. But it seems there is an issue, as we still having 16 queues although the RSS params was
set to 8.

Once done, the next thing is to setup the IRQ handling to have each CPU linked in order with
the corresponding RX queue. irqbalance was running on the system and the setup was
correctly made.

The interface was using IRQ 101 to 116 and /proc/interrupts show a diagonale indicating
that each CPU was assigned to one interrupt.

If not, it was possible to use the instruction contained in IRQ-affinity.txt available
in the Documentation directory of Linux sources.

But the easy way to do it is to use the script provided with the driver:

ixgbe-3.10.16/scripts$ ./set_irq_affinity.sh eth3

Note: Intel latest driver was responsible of a decrease of CPU usage. With Ubuntu kernel version, the CPU usage as 80% and it is 45% with latest Intel driver.

The card used on the system was not load-balancing UDP flow using port. We had to use
‘ethtool’ to fix this

regit@suricata:~$ sudo ethtool -n eth3 rx-flow-hash udp4
UDP over IPV4 flows use these fields for computing Hash flow key:
IP SA
IP DA

regit@suricata:~$ sudo ethtool -N eth3 rx-flow-hash udp4 sdfn
regit@suricata:~$ sudo ethtool -n eth3 rx-flow-hash udp4
UDP over IPV4 flows use these fields for computing Hash flow key:
IP SA
IP DA
L4 bytes 0 & 1 [TCP/UDP src port]
L4 bytes 2 & 3 [TCP/UDP dst port]

In our case, the default setting of the ring parameters of the card, seems
to indicate it is possible to increase the ring buffer on the card

regit@suricata:~$ ethtool -g eth3
Ring parameters for eth3:
Pre-set maximums:
RX:             4096
RX Mini:        0
RX Jumbo:       0
TX:             4096
Current hardware settings:
RX:             512
RX Mini:        0
RX Jumbo:       0
TX:             512

Our system is now ready and we can start configuring Suricata.

Suricata setup

Global variables

The run mode has been set to ‘workers’

max-pending-packets: 512
runmode: workers

As pointed out by Victor Julien, this is not necessary to increase max-pending-packets too much because only a number of packets equal to the total number of worker threads can be treated simultaneously.

Suricata 1.4beta1 introduce a delayed-detect variable under detect-engine. If set to yes, this trigger a build of signature after the packet capture threads have started working. This is a potential issue if your system is short in CPU as the task of building the detect engine is CPU intensive and can cause some packet loss. That’s why it is recommended to let it to the default value of no.

AF_PACKET

The AF_PACKET configuration is almost straight forward

af-packet:
  - interface: eth3
    threads: 16
    cluster-id: 99
    cluster-type: cluster_cpu
    defrag: yes
    use-mmap: yes
    ring-size: 300000
Affinity

Affinity settings permit to assign thread to set of CPUs. In our case, we onlSet to have in exclusive mode one packet thread dedicated to each CPU. The setting
used to define packet thread property in ‘workers’ mode is ‘detect-cpu-set’

threading:
  set-cpu-affinity: yes
  cpu-affinity:
    - management-cpu-set:
      cpu: [ "all" ]
      mode: "balanced"
      prio:
        default: "low"

  - detect-cpu-set:
      cpu: ["all"]
      mode: "exclusive" # run detect threads in these cpus
      prio:
        default: "high"

The idea is to assign the highest prio to detect threads and to let the OS do its best
to dispatch the remaining work among the CPUs (balanced mode on all CPUs for the management).

Defrag

Some tuning was needed here. The network was exhibing some serious fragmentation
and we have to modify the default settings

defrag:
  memcap: 512mb
  trackers: 65535 # number of defragmented flows to follow
  max-frags: 65535  # number of fragments

The ‘trackers’ variable was not documented in the original YAML configuration file.
Although defined in the YAML, the ‘max-frags’ one was not used by Suricata. A patch
has been made to implement this.

Streaming

The variables relative to streaming have been set very high

stream:
  memcap: 12gb
  max-sessions: 20000000
  prealloc-sessions: 10000000
  inline: no                    # no inline mode
  reassembly:
    memcap: 14gb
    depth: 6mb                  # reassemble 1mb into a stream
    toserver-chunk-size: 2560
    toclient-chunk-size: 2560

To detect the potential issue with memcap, one can read the ‘stats.log’ file
which contains various counters. Some of them matching the ‘memcap’ string.

Running suricata

Suricata can now be runned with the usual command line

sudo suricata -c /etc/suricata.yaml --af-packet=eth3

Our affinity setup is working as planned as show the following log line

Setting prio -2 for "AFPacketeth34" Module to cpu/core 3, thread id 30415

Tests

Tests have been made by simply running Suricata against the massive traffic
mirrored on the eth3 interface.

At first, we started Suricata without rules to see if it was able to deal
with the amount of packets for a long period. Most of the tuning was done
during this phase.

To detect packet loss, the capture keyword can be search in ‘stats.log’.
If ‘kernel_drops’ is set to 0, this is good

capture.kernel_packets    | AFPacketeth315            | 1436331302
capture.kernel_drops      | AFPacketeth315            | 0
capture.kernel_packets    | AFPacketeth316            | 1449320230
capture.kernel_drops      | AFPacketeth316            | 0

The statistics are available for each thread. For example, ‘AFPacketeth315’ is
the 15th AFPacket thread bound to eth3.

When this phase was complete we did add some rules by using Emerging Threat PRO rules
for malware, trojan and some others:

rule-files:
 - trojan.rules
 - malware.rules
 - chat.rules
 - current_events.rules
 - dns.rules
 - mobile_malware.rules
 - scan.rules
 - user_agents.rules
 - web_server.rules
 - worm.rules

This ruleset has the following characterics:

  • 6719 signatures processed
  • 8 are IP-only rules
  • 2307 are inspecting packet payload
  • 5295 inspect application layer
  • 0 are decoder event only

This is thus a decent ruleset with a high part of application level event which require a
complex processing. With that ruleset, there is more than 16 alerts per second (output in unified2 format).

With the previously mentioned ruleset, the load of each CPU is around 60% and Suricata
is remaining stable during hours long run.

In most run, we’ve observed some packet loss between capture start and first time Suricata grab the statistics. It seems the initialization phase is not fast enough.

Conclusion

OISF team has access to the box for a week now and has already
managed to get real performance. We will continue to work on it to provide
the best possible experience to all Suricata’s users.

Feel free to made any remark and suggestion about this blog post and this setup.

Flow accounting with Netfilter and ulogd2

Introduction

Starting with Linux kernel 3.3, there’s a new module called nfnetlink_acct.
This new feature added by Pablo Neira brings interesting accountig capabilities to Netfilter.
Pablo has made an extensive description of the feature in the commit.

System setup

We need to build a set of tools to get all that’s necessary:

  • libmnl
  • libnetfilter_acct
  • nfacct

The build is the same for all projects:

git clone git://git.netfilter.org/PROJECT
cd PROJECT
autoreconf -i
./configure
make
sudo make install

nfacct

This command line tool is here to set up and interact with the accounting subsystem. To get the help you can use the man page or run:

# nfacct help
nfacct v1.0.0: utility for the Netfilter extended accounting infrastructure
Usage: nfacct command [parameters]...

Commands:
  list [reset]		List the accounting object table (and reset)
  add object-name	Add new accounting object to table
  delete object-name	Delete existing accounting object
  get object-name	Get existing accounting object
  flush			Flush accounting object table
  version		Display version and disclaimer
  help			Display this help message

Configuration

Objectives

Let’s have for objectives to get the following statistics:

  • IPv6 data usage
    • http on IPv6 usage
    • https on IPv6 usage
  • IPv4 data usage
    • http on IPv4 usage
    • https on IPv4 usage

Ulogd2 configuration

Let’s start by a simple output to XML. For that we will add the following stack:

stack=acct1:NFACCT,xml1:XML

and this one:

stack=acct1:NFACCT,gp1:GPRINT

nfacct setup

modprobe nfnetlink_acct
nfacct add ipv6
nfacct add http-ipv6
nfacct add https-ipv6
nfacct add ipv4
nfacct add http-ipv4
nfacct add https-ipv4

iptables setup

iptables -I INPUT -m nfacct --nfacct-name ipv4
iptables -I INPUT -p tcp --sport 80 -m nfacct --nfacct-name http-ipv4
iptables -I INPUT -p tcp --sport 443 -m nfacct --nfacct-name https-ipv4
iptables -I OUTPUT -m nfacct --nfacct-name ipv4
iptables -I OUTPUT -p tcp --dport 80 -m nfacct --nfacct-name http-ipv4
iptables -I OUTPUT -p tcp --dport 443 -m nfacct --nfacct-name https-ipv4

ip6tables setup

ip6tables -I INPUT -m nfacct --nfacct-name ipv6
ip6tables -I INPUT -p tcp --sport 80 -m nfacct --nfacct-name http-ipv6
ip6tables -I INPUT -p tcp --sport 443 -m nfacct --nfacct-name https-ipv6
ip6tables -I OUTPUT -m nfacct --nfacct-name ipv6
ip6tables -I OUTPUT -p tcp --dport 80 -m nfacct --nfacct-name http-ipv6
ip6tables -I OUTPUT -p tcp --dport 443 -m nfacct --nfacct-name https-ipv6

Starting the beast

Now we can start ulogd2:

ulogd2 -c /etc/ulogd.conf

In /var/log, we will have the following files:

  • ulogd_gprint.log: display stats for each counter on one line
  • ulogd-sum-14072012-224313.xml: XML dump
  • ulogd.log: the daemon log file to look at in case of problem

Output examples

In the ulogd_gprint.log file, the ouput for a given timestamp is something like that:

timestamp=2012/07/14-22:48:17,sum.name=http-ipv6,sum.pkts=0,sum.bytes=0
timestamp=2012/07/14-22:48:17,sum.name=https-ipv6,sum.pkts=0,sum.bytes=0
timestamp=2012/07/14-22:48:17,sum.name=ipv4,sum.pkts=20563,sum.bytes=70
timestamp=2012/07/14-22:48:17,sum.name=http-ipv4,sum.pkts=0,sum.bytes=0
timestamp=2012/07/14-22:48:17,sum.name=https-ipv4,sum.pkts=16683,sum.bytes=44
timestamp=2012/07/14-22:48:17,sum.name=ipv6,sum.pkts=0,sum.bytes=0

The XML output is the following:

<obj><name>http-ipv6</name><pkts>00000000000000000000</pkts><bytes>00000000000000000000</bytes><hour>22</hour><min>43</min><sec>15</sec><wday>7</wday><day>14</day><month>7</month><year>2012</year></obj>
<obj><name>https-ipv6</name><pkts>00000000000000000000</pkts><bytes>00000000000000000000</bytes><hour>22</hour><min>43</min><sec>15</sec><wday>7</wday><day>14</day><month>7</month><year>2012</year></obj>
<obj><name>ipv4</name><pkts>00000000000000000052</pkts><bytes>00000000000000006291</bytes><hour>22</hour><min>43</min><sec>15</sec><wday>7</wday><day>14</day><month>7</month><year>2012</year></obj>
<obj><name>http-ipv4</name><pkts>00000000000000000009</pkts><bytes>00000000000000000408</bytes><hour>22</hour><min>43</min><sec>15</sec><wday>7</wday><day>14</day><month>7</month><year>2012</year></obj>
<obj><name>https-ipv4</name><pkts>00000000000000000031</pkts><bytes>00000000000000004041</bytes><hour>22</hour><min>43</min><sec>15</sec><wday>7</wday><day>14</day><month>7</month><year>2012</year></obj>
<obj><name>ipv6</name><pkts>00000000000000000002</pkts><bytes>00000000000000000254</bytes><hour>22</hour><min>43</min><sec>15</sec><wday>7</wday><day>14</day><month>7</month><year>2012</year></obj>

Conclusion

nfacct and ulogd2 offers a easy and efficient way to gather network statistics. Some tools and glue are currently lacking to fill the data inside reporting tool but the log structure is clean and it should not be too difficult.